
- Start >
- Rivers >
- Discharge >
- Naab - Regen >
- Unterbruck Flutmulde >
- Chart of year

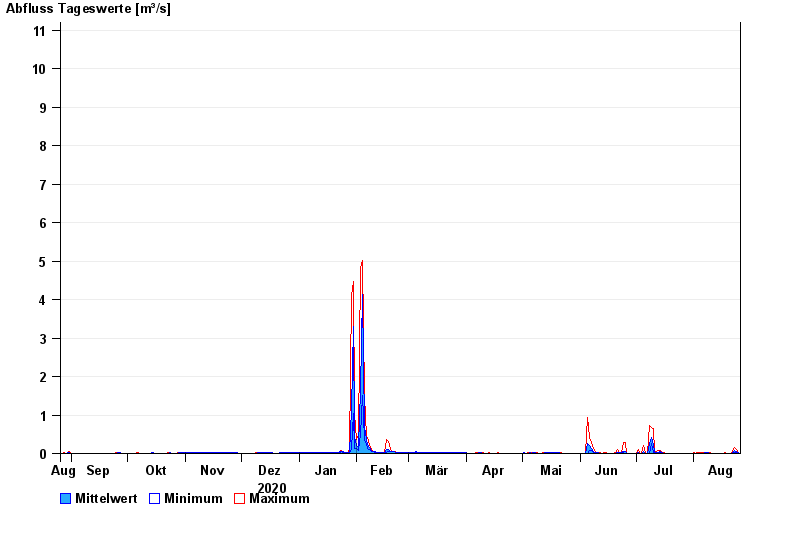
Chart of year Unterbruck Flutmulde / Haidenaab
Discharge from 26.08.2020 to 25.08.2021
 Für diesen Pegel sind keine Jährlichkeiten hinterlegt.
| Date | Mean value [m³/s] | Maximum [m³/s] | Minimum [m³/s] |
|---|---|---|---|
| 25.08.2021 | 0.025 | 0.028 | 0.022 |
| 24.08.2021 | 0.04 | 0.093 | 0.028 |
| 23.08.2021 | 0.073 | 0.162 | 0.023 |
| 22.08.2021 | 0.028 | 0.12 | 0.009 |
| 21.08.2021 | 0.009 | 0.01 | 0.009 |
| 20.08.2021 | 0.01 | 0.011 | 0.009 |
| 19.08.2021 | 0.01 | 0.01 | 0.009 |
© Bayerisches Landesamt für Umwelt 2024