
- Start >
- Rivers >
- Discharge >
- Naab - Regen >
- Unterbruck Flutmulde >
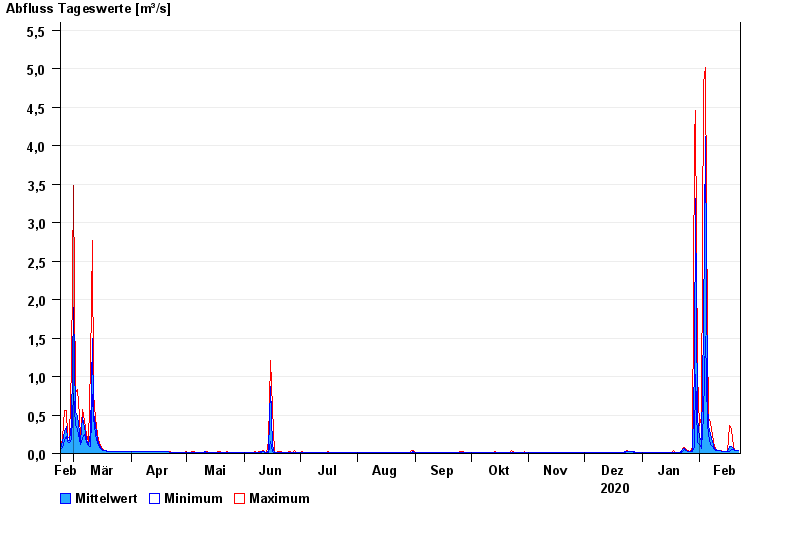
- Chart of year

Chart of year Unterbruck Flutmulde / Haidenaab
Discharge from 23.02.2020 to 22.02.2021
| Date | Mean value [m³/s] | Maximum [m³/s] | Minimum [m³/s] |
|---|---|---|---|
| 22.02.2021 | 0.036 | 0.04 | 0.033 |
| 21.02.2021 | 0.041 | 0.045 | 0.04 |
| 20.02.2021 | 0.046 | 0.05 | 0.045 |
| 19.02.2021 | 0.059 | 0.096 | 0.05 |
| 18.02.2021 | 0.092 | 0.309 | 0.05 |
| 17.02.2021 | 0.097 | 0.368 | 0.025 |
| 16.02.2021 | 0.025 | 0.025 | 0.025 |
© Bayerisches Landesamt für Umwelt 2024