
- Start >
- Rivers >
- Discharge >
- Naab - Regen >
- Unterbruck Flutmulde >
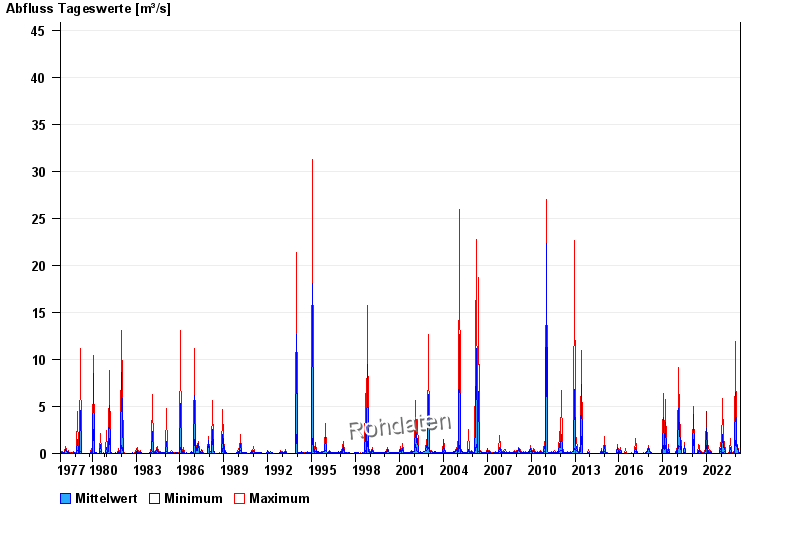
- Chart of total period

Chart of total period Unterbruck Flutmulde / Haidenaab
Discharge from 01.11.1977 to 23.04.2024
- 00.00.0000 Abfluss: m³/s
- 00.00.0000 Abfluss: m³/s
- 00.00.0000 Abfluss: m³/s
- 00.00.0000 Abfluss: m³/s
- 00.00.0000 Abfluss: m³/s
| Date | Mean value [m³/s] | Maximum [m³/s] | Minimum [m³/s] |
|---|---|---|---|
| 23.04.2024 | 0.027 | 0.046 | 0.018 |
| 22.04.2024 | 0.105 | 0.236 | 0.043 |
| 21.04.2024 | 0.059 | 0.205 | 0.008 |
| 20.04.2024 | 0.011 | 0.015 | 0.008 |
| 19.04.2024 | 0.007 | 0.01 | 0.005 |
| 18.04.2024 | 0.005 | 0.005 | 0.005 |
| 17.04.2024 | 0.005 | 0.006 | 0.005 |
© Bayerisches Landesamt für Umwelt 2024