
- Start >
- Rivers >
- Discharge >
- Naab - Regen >
- Unterbruck >
- Chart of month

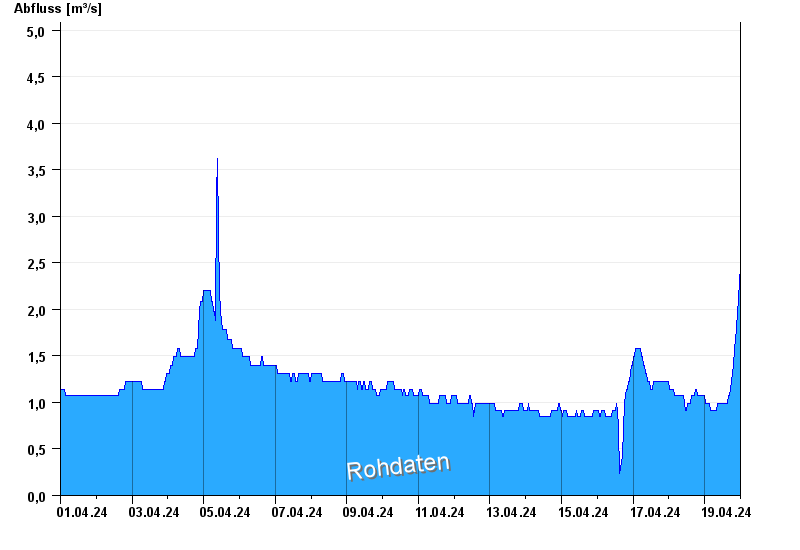
Chart of month Unterbruck / Haidenaab
Discharge from 01.04.2024 to 19.04.2024
- 28.05.2006 Abfluss: 50,3 m³/s
- 13.02.2005 Abfluss: 49,5 m³/s
- 14.01.2011 Abfluss: 48,5 m³/s
- 06.01.1982 Abfluss: 46,6 m³/s
- 23.12.2012 Abfluss: 46,1 m³/s
| Date | Runoff [m³/s] |
|---|---|
| 19.04.2024 04:30 | 0.914 |
| 19.04.2024 04:15 | 0.914 |
| 19.04.2024 04:00 | 0.914 |
| 19.04.2024 03:45 | 0.914 |
| 19.04.2024 03:30 | 0.914 |
| 19.04.2024 03:15 | 0.988 |
| 19.04.2024 03:00 | 0.988 |
© Bayerisches Landesamt für Umwelt 2024