
- Start >
- Rivers >
- Discharge >
- Naab - Regen >
- Tiefenbach >
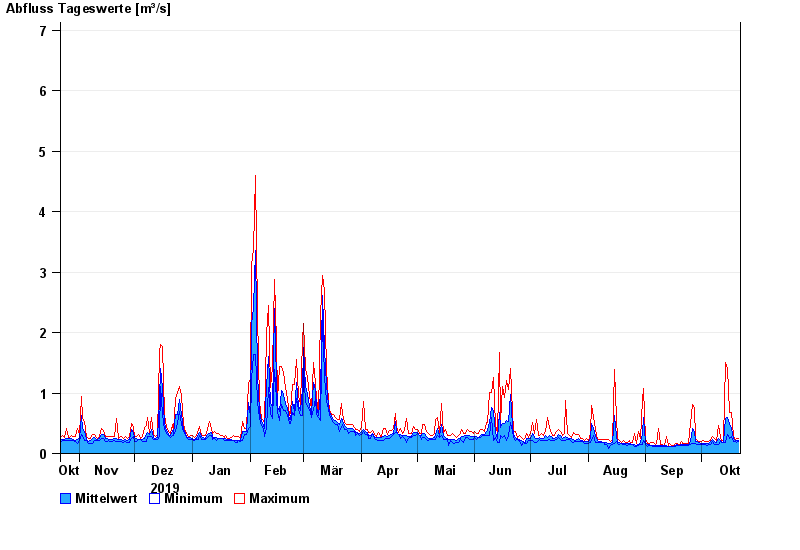
- Chart of year

Chart of year Tiefenbach / Bayerische Schwarzach
Discharge from 22.10.2019 to 21.10.2020
- 05.12.1988 Abfluss: 29,5 m³/s
- 26.01.1995 Abfluss: 26 m³/s
- 21.12.1993 Abfluss: 23,5 m³/s
- 26.02.1997 Abfluss: 19,7 m³/s
- 30.12.1986 Abfluss: 19,2 m³/s
| Date | Mean value [m³/s] | Maximum [m³/s] | Minimum [m³/s] |
|---|---|---|---|
| 21.10.2020 | 0.223 | 0.253 | 0.199 |
| 20.10.2020 | 0.215 | 0.253 | 0.176 |
| 19.10.2020 | 0.213 | 0.225 | 0.199 |
| 18.10.2020 | 0.243 | 0.283 | 0.199 |
| 17.10.2020 | 0.418 | 0.676 | 0.283 |
| 16.10.2020 | 0.493 | 0.676 | 0.252 |
| 15.10.2020 | 0.59 | 1.4 | 0.315 |
© Bayerisches Landesamt für Umwelt 2024