
- Start >
- Rivers >
- Discharge >
- Naab - Regen >
- Tiefenbach >
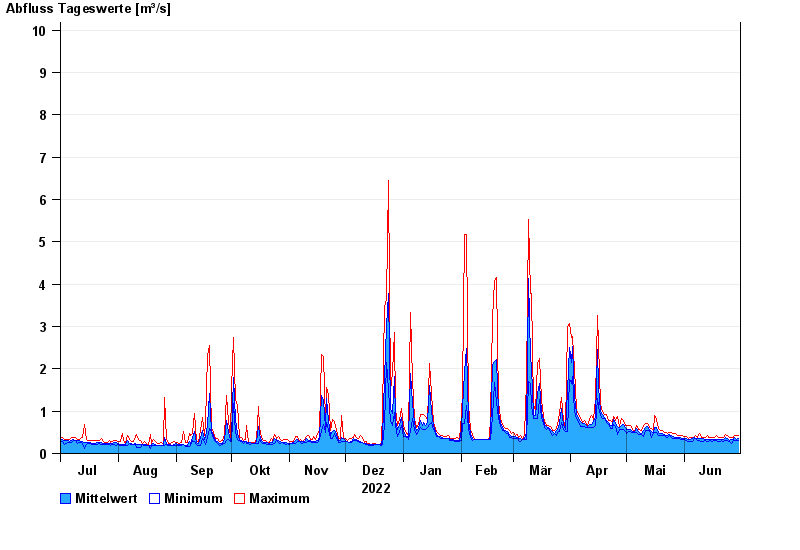
- Chart of year

Chart of year Tiefenbach / Bayerische Schwarzach
Discharge from 01.07.2022 to 30.06.2023
- 05.12.1988 Abfluss: 29,5 m³/s
- 26.01.1995 Abfluss: 26 m³/s
- 21.12.1993 Abfluss: 23,5 m³/s
- 26.02.1997 Abfluss: 19,7 m³/s
- 30.12.1986 Abfluss: 19,2 m³/s
| Date | Mean value [m³/s] | Maximum [m³/s] | Minimum [m³/s] |
|---|---|---|---|
| 30.06.2023 | 0.344 | 0.415 | 0.307 |
| 29.06.2023 | 0.341 | 0.415 | 0.307 |
| 28.06.2023 | 0.368 | 0.415 | 0.306 |
| 27.06.2023 | 0.33 | 0.377 | 0.306 |
| 26.06.2023 | 0.322 | 0.377 | 0.243 |
| 25.06.2023 | 0.314 | 0.377 | 0.274 |
| 24.06.2023 | 0.359 | 0.414 | 0.306 |
© Bayerisches Landesamt für Umwelt 2024