
- Start >
- Rivers >
- Discharge >
- Naab - Regen >
- Tiefenbach >
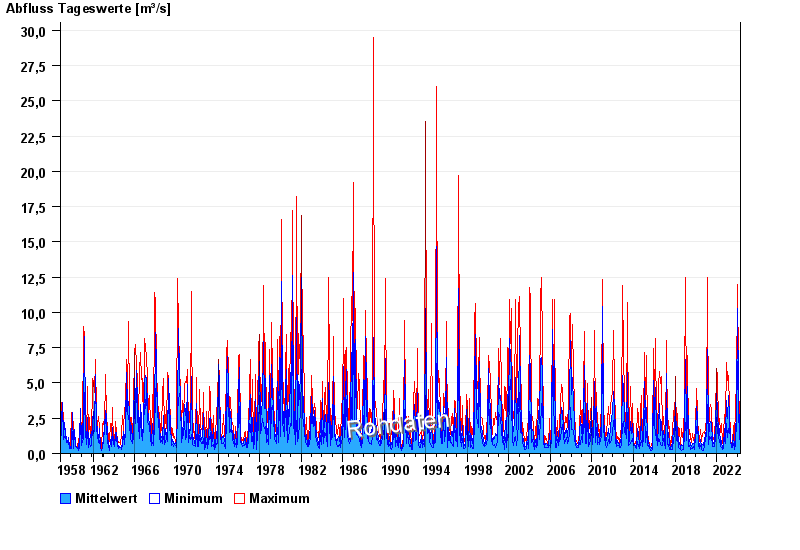
- Chart of total period

Chart of total period Tiefenbach / Bayerische Schwarzach
Discharge from 01.11.1958 to 19.04.2024
| Date | Mean value [m³/s] | Maximum [m³/s] | Minimum [m³/s] |
|---|---|---|---|
| 19.04.2024 | 1.43 | 1.67 | 1.25 |
| 18.04.2024 | 1.7 | 2.09 | 1.35 |
| 17.04.2024 | 1.06 | 1.35 | 0.91 |
| 16.04.2024 | 0.818 | 1.2 | 0.639 |
| 15.04.2024 | 0.728 | 0.91 | 0.595 |
| 14.04.2024 | 0.621 | 0.728 | 0.552 |
| 13.04.2024 | 0.629 | 0.683 | 0.595 |
© Bayerisches Landesamt für Umwelt 2024