
- Start >
- Rivers >
- Discharge >
- Naab - Regen >
- Teisnach >
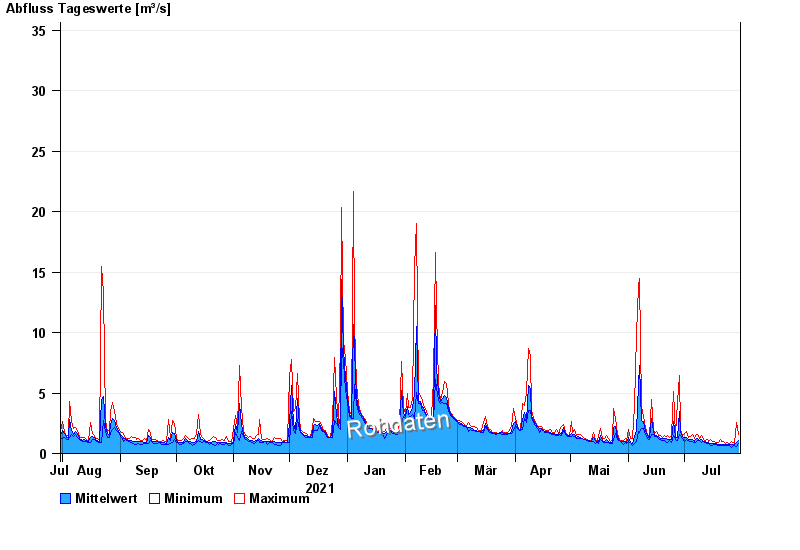
- Chart of year

Chart of year Teisnach / Teisnach
Discharge from 31.07.2021 to 30.07.2022
- 01.11.1998 Abfluss: 87,6 m³/s
- 05.12.1988 Abfluss: 79,7 m³/s
- 15.09.1998 Abfluss: 73,7 m³/s
- 23.12.1967 Abfluss: 71,7 m³/s
- 29.10.1998 Abfluss: 67,3 m³/s
| Date | Mean value [m³/s] | Maximum [m³/s] | Minimum [m³/s] |
|---|---|---|---|
| 30.07.2022 | 1.07 | 1.57 | 0.813 |
| 29.07.2022 | 0.941 | 2.57 | 0.564 |
| 28.07.2022 | 0.741 | 0.813 | 0.682 |
| 27.07.2022 | 0.759 | 0.884 | 0.682 |
| 26.07.2022 | 0.751 | 0.955 | 0.461 |
| 25.07.2022 | 0.746 | 0.813 | 0.682 |
| 24.07.2022 | 0.771 | 0.884 | 0.682 |
© Bayerisches Landesamt für Umwelt 2024