
- Start >
- Rivers >
- Discharge >
- Naab - Regen >
- Ösbühl >
- Chart of year

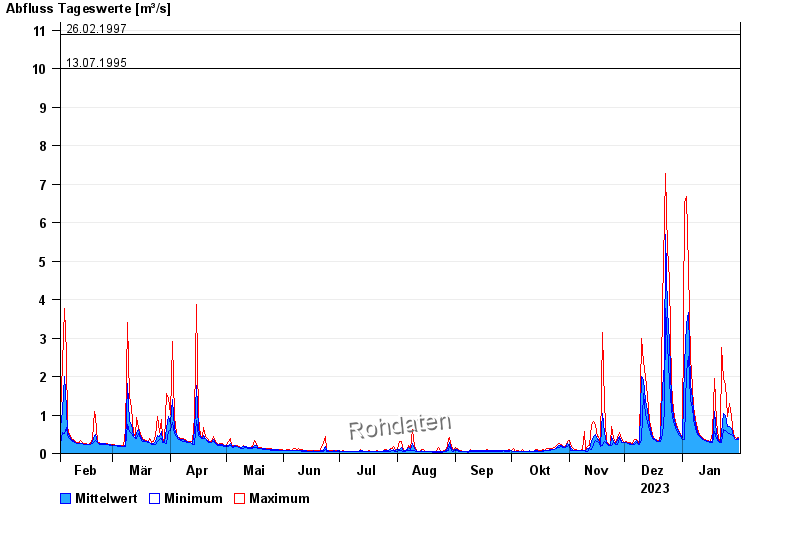
Chart of year Ösbühl / Danglesbach
Discharge from 01.02.2023 to 31.01.2024
- 21.12.1993 Abfluss: 12,5 m³/s
- 01.11.1998 Abfluss: 12 m³/s
- 26.01.1995 Abfluss: 12 m³/s
- 26.02.1997 Abfluss: 10,9 m³/s
- 13.07.1995 Abfluss: 10 m³/s
| Date | Mean value [m³/s] | Maximum [m³/s] | Minimum [m³/s] |
|---|---|---|---|
| 31.01.2024 | 0.38 | 0.412 | 0.357 |
| 30.01.2024 | 0.373 | 0.393 | 0.357 |
| 29.01.2024 | 0.402 | 0.431 | 0.393 |
| 28.01.2024 | 0.45 | 0.492 | 0.431 |
| 27.01.2024 | 0.647 | 0.955 | 0.492 |
| 26.01.2024 | 0.709 | 1.3 | 0.512 |
| 25.01.2024 | 0.694 | 0.955 | 0.556 |
© Bayerisches Landesamt für Umwelt 2024