
- Start >
- Rivers >
- Discharge >
- Naab - Regen >
- Obersdorf >
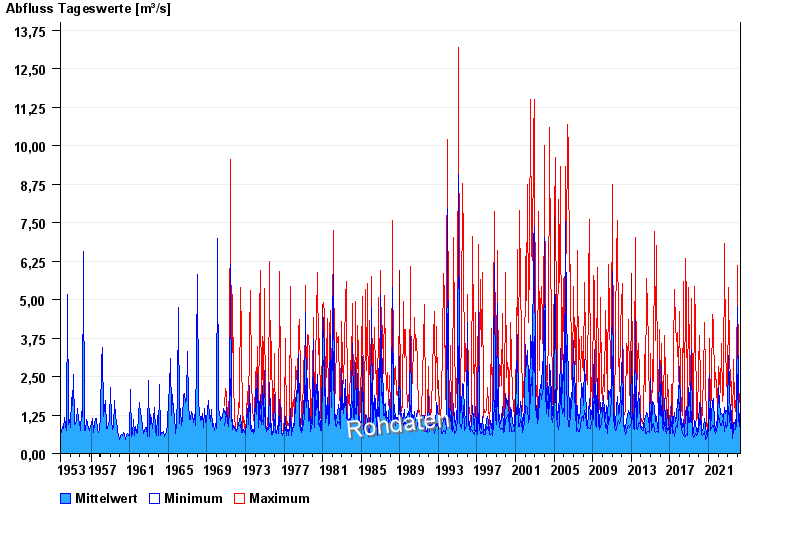
- Chart of total period

Chart of total period Obersdorf / Rosenbach
Discharge from 01.11.1953 to 25.04.2024
| Date | Mean value [m³/s] | Maximum [m³/s] | Minimum [m³/s] |
|---|---|---|---|
| 25.04.2024 | 0.946 | 1.09 | 0.87 |
| 24.04.2024 | 0.938 | 0.958 | 0.914 |
| 23.04.2024 | 0.96 | 0.994 | 0.958 |
| 22.04.2024 | 1.09 | 1.28 | 0.994 |
| 21.04.2024 | 1.24 | 1.66 | 1.04 |
| 20.04.2024 | 1.24 | 1.38 | 1.09 |
| 19.04.2024 | 1.1 | 1.77 | 0.829 |
© Bayerisches Landesamt für Umwelt 2024