
- Start >
- Rivers >
- Discharge >
- Naab - Regen >
- Obersdorf >
- Chart of total period

Chart of total period Obersdorf / Rosenbach
Discharge from 01.11.1953 to 19.04.2024
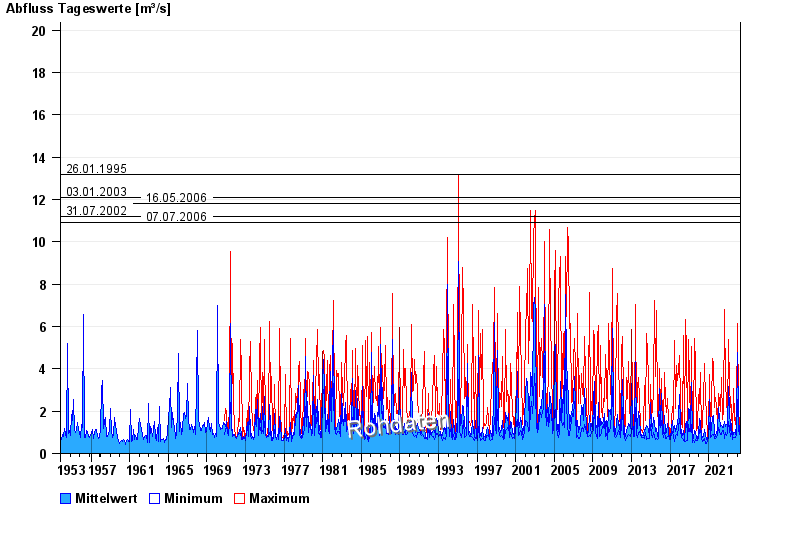
- 26.01.1995 Abfluss: 13,2 m³/s
- 03.01.2003 Abfluss: 12,1 m³/s
- 16.05.2006 Abfluss: 11,8 m³/s
- 31.07.2002 Abfluss: 11,2 m³/s
- 07.07.2006 Abfluss: 10,9 m³/s
| Date | Mean value [m³/s] | Maximum [m³/s] | Minimum [m³/s] |
|---|---|---|---|
| 19.04.2024 | 0.829 | 0.829 | 0.829 |
| 18.04.2024 | 0.919 | 1.09 | 0.87 |
| 17.04.2024 | 0.909 | 1.04 | 0.87 |
| 16.04.2024 | 0.995 | 1.28 | 0.829 |
| 15.04.2024 | 0.898 | 1.09 | 0.789 |
| 14.04.2024 | 0.816 | 0.87 | 0.789 |
| 13.04.2024 | 0.813 | 0.829 | 0.789 |
© Bayerisches Landesamt für Umwelt 2024