
- Start >
- Rivers >
- Discharge >
- Naab - Regen >
- Michelfeld >
- Chart of year

Chart of year Michelfeld / Pegnitz
Discharge from 01.01.2024 to 23.04.2024
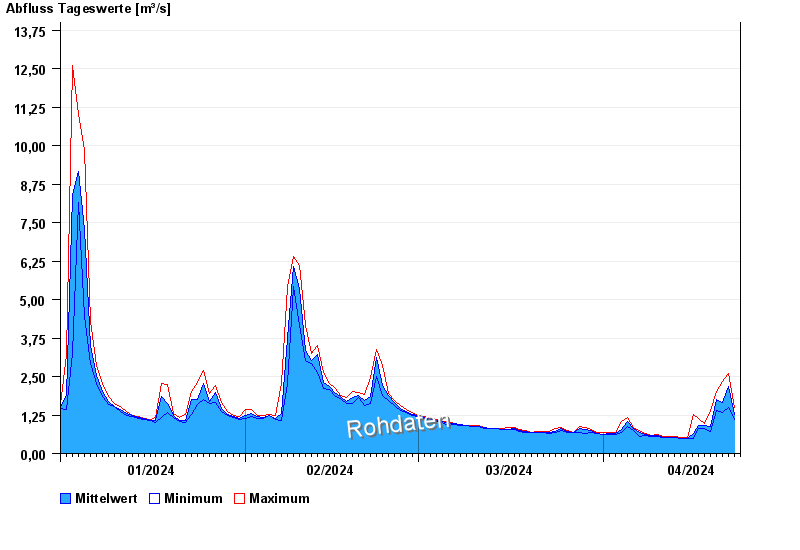
| Date | Mean value [m³/s] | Maximum [m³/s] | Minimum [m³/s] |
|---|---|---|---|
| 23.04.2024 | 1.31 | 1.49 | 1.2 |
| 22.04.2024 | 2.18 | 2.59 | 1.49 |
| 21.04.2024 | 1.66 | 2.35 | 1.33 |
| 20.04.2024 | 1.76 | 2.02 | 1.41 |
| 19.04.2024 | 0.887 | 1.41 | 0.722 |
| 18.04.2024 | 0.902 | 0.971 | 0.824 |
| 17.04.2024 | 0.922 | 1.15 | 0.824 |
© Bayerisches Landesamt für Umwelt 2024