
- Start >
- Rivers >
- Discharge >
- Naab - Regen >
- Lohma Q >
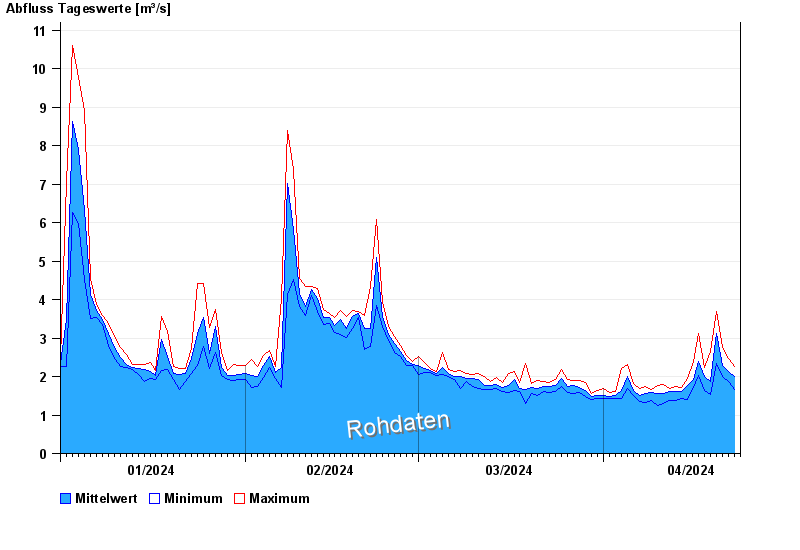
- Chart of year

Chart of year Lohma Q / Zottbach
Discharge from 01.01.2024 to 23.04.2024
note
Abflusswerte sind Werte der Ultraschallanlage!
| Date | Mean value [m³/s] | Maximum [m³/s] | Minimum [m³/s] |
|---|---|---|---|
| 23.04.2024 | 2.07 | 2.26 | 1.89 |
| 22.04.2024 | 2.12 | 2.47 | 1.86 |
| 21.04.2024 | 2.29 | 2.75 | 1.99 |
| 20.04.2024 | 3.13 | 3.68 | 2.35 |
| 19.04.2024 | 1.87 | 2.66 | 1.54 |
| 18.04.2024 | 2.01 | 2.23 | 1.64 |
| 17.04.2024 | 2.38 | 3.12 | 2.02 |
© Bayerisches Landesamt für Umwelt 2024