
- Start >
- Rivers >
- Discharge >
- Naab - Regen >
- Lohma Q >
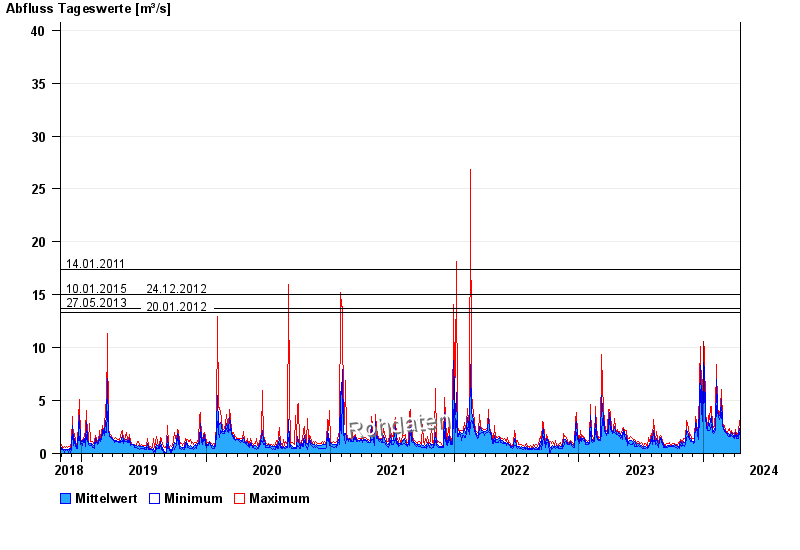
- Chart of total period

Chart of total period Lohma Q / Zottbach
Discharge from 30.10.2018 to 19.04.2024
note
Abflusswerte sind Werte der Ultraschallanlage!
- 14.01.2011 Abfluss: 17,4 m³/s
- 10.01.2015 Abfluss: 15 m³/s
- 24.12.2012 Abfluss: 15 m³/s
- 27.05.2013 Abfluss: 13,7 m³/s
- 20.01.2012 Abfluss: 13,3 m³/s
| Date | Mean value [m³/s] | Maximum [m³/s] | Minimum [m³/s] |
|---|---|---|---|
| 19.04.2024 | 1.72 | 1.94 | 1.59 |
| 18.04.2024 | 2.01 | 2.23 | 1.64 |
| 17.04.2024 | 2.38 | 3.12 | 2.02 |
| 16.04.2024 | 1.93 | 2.39 | 1.71 |
| 15.04.2024 | 1.77 | 1.95 | 1.4 |
| 14.04.2024 | 1.6 | 1.72 | 1.43 |
| 13.04.2024 | 1.62 | 1.73 | 1.39 |
© Bayerisches Landesamt für Umwelt 2024