
- Start >
- Rivers >
- Discharge >
- Naab - Regen >
- Kötzting >
- Chart of total period

Chart of total period Kötzting / Weißer Regen
Discharge from 01.11.1947 to 24.04.2024
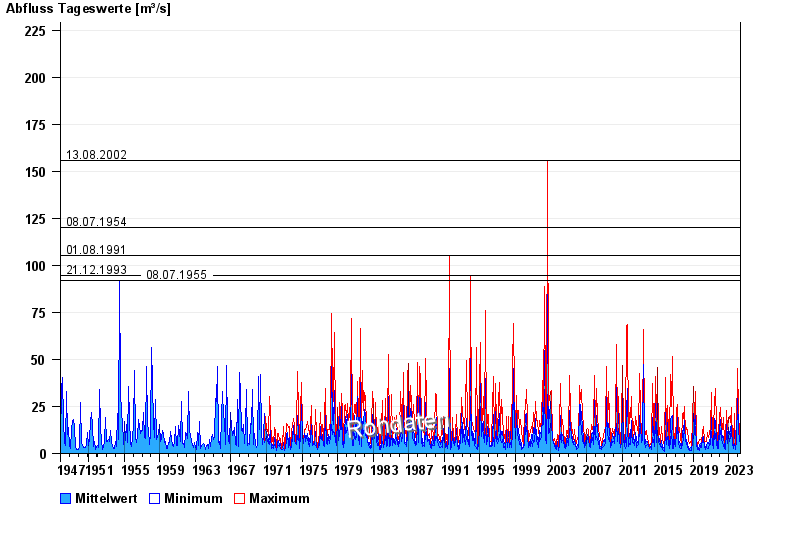
- 13.08.2002 Abfluss: 156 m³/s
- 08.07.1954 Abfluss: 120 m³/s
- 01.08.1991 Abfluss: 105 m³/s
- 21.12.1993 Abfluss: 94,5 m³/s
- 08.07.1955 Abfluss: 92,2 m³/s
| Date | Mean value [m³/s] | Maximum [m³/s] | Minimum [m³/s] |
|---|---|---|---|
| 24.04.2024 | 3.11 | 3.43 | 2.71 |
| 23.04.2024 | 3.39 | 3.74 | 3.13 |
| 22.04.2024 | 4.01 | 4.77 | 3.43 |
| 21.04.2024 | 5.02 | 6.36 | 4.24 |
| 20.04.2024 | 9.02 | 12 | 6.15 |
| 19.04.2024 | 4.56 | 10.3 | 3.28 |
| 18.04.2024 | 4.58 | 5.34 | 3.91 |
© Bayerisches Landesamt für Umwelt 2024