
- Start >
- Rivers >
- Discharge >
- Naab - Regen >
- Kienhof >
- Chart of total period

Chart of total period Kienhof / Regen
Discharge from 01.11.1958 to 20.04.2024
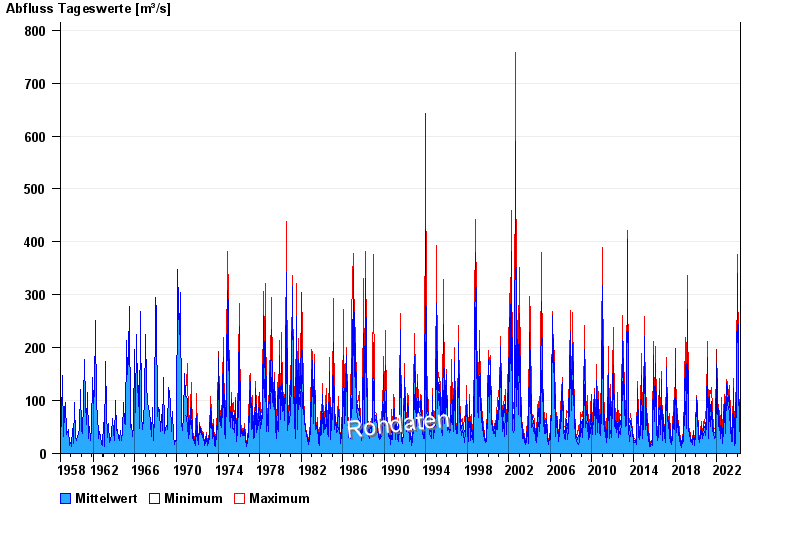
| Date | Mean value [m³/s] | Maximum [m³/s] | Minimum [m³/s] |
|---|---|---|---|
| 20.04.2024 | 37.9 | 38.7 | 37.8 |
| 19.04.2024 | 40.3 | 43.9 | 36.9 |
| 18.04.2024 | 37.6 | 43.9 | 33.6 |
| 17.04.2024 | 30.2 | 34.4 | 26 |
| 16.04.2024 | 22.4 | 26 | 20.4 |
| 15.04.2024 | 20.4 | 22.4 | 19.2 |
| 14.04.2024 | 20.4 | 21.8 | 19.8 |
© Bayerisches Landesamt für Umwelt 2024