
- Start >
- Rivers >
- Discharge >
- Naab - Regen >
- Kempten >
- Chart of year

Chart of year Kempten / Iller
Discharge from 30.11.2021 to 29.11.2022
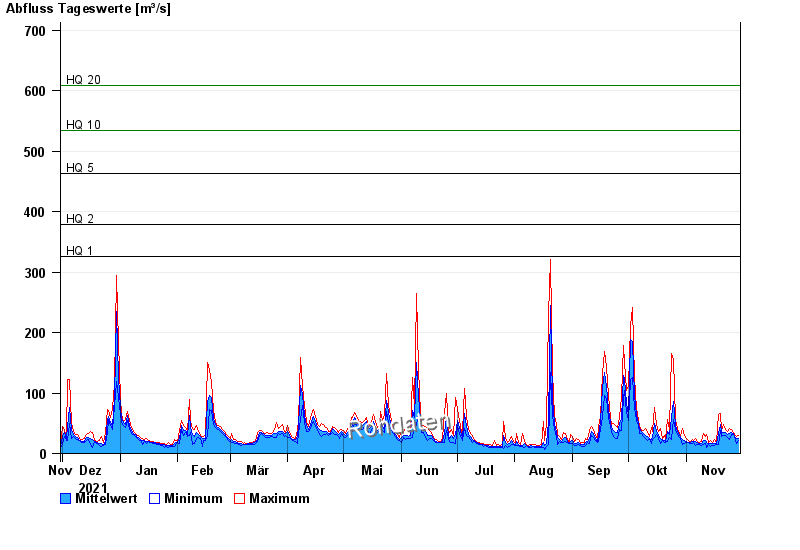
- HQ1 326 m³/s
- HQ2 379 m³/s
- HQ5 463 m³/s
- HQ10 534 m³/s
- HQ20 609 m³/s
- HQ50 728 m³/s
- HQ100 829 m³/s
| Date | Mean value [m³/s] | Maximum [m³/s] | Minimum [m³/s] |
|---|---|---|---|
| 29.11.2022 | 25.1 | 30 | 21.8 |
| 28.11.2022 | 25.5 | 27.3 | 16.5 |
| 27.11.2022 | 28.6 | 31.3 | 27.3 |
| 26.11.2022 | 32.5 | 34.9 | 30.6 |
| 25.11.2022 | 34.5 | 39.4 | 30.6 |
| 24.11.2022 | 33.7 | 40.9 | 23.6 |
| 23.11.2022 | 31.5 | 36.3 | 26.7 |
© Bayerisches Landesamt für Umwelt 2024