
- Start >
- Rivers >
- Discharge >
- Naab - Regen >
- Johannisthal >
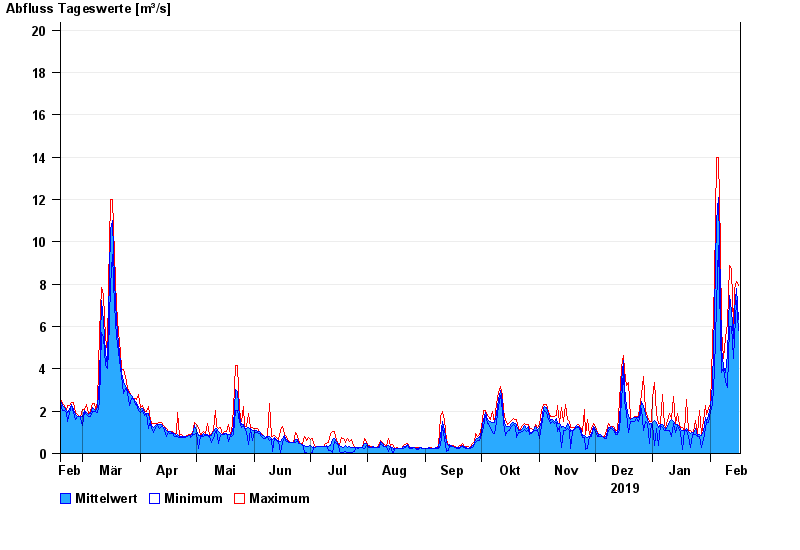
- Chart of year

Chart of year Johannisthal / Tirschenreuther Waldnaab
Discharge from 17.02.2019 to 16.02.2020
- 06.01.1982 Abfluss: 64,1 m³/s
- 06.02.1980 Abfluss: 50,2 m³/s
- 03.01.2003 Abfluss: 49,6 m³/s
- 26.01.1995 Abfluss: 47,6 m³/s
- 02.11.1998 Abfluss: 47,1 m³/s
| Date | Mean value [m³/s] | Maximum [m³/s] | Minimum [m³/s] |
|---|---|---|---|
| 16.02.2020 | 6.31 | 7.96 | 5.83 |
| 15.02.2020 | 7.79 | 8.14 | 7.23 |
| 14.02.2020 | 6.78 | 7.77 | 5.48 |
| 13.02.2020 | 5.41 | 5.99 | 4.49 |
| 12.02.2020 | 6.78 | 8.69 | 5.99 |
| 11.02.2020 | 7.45 | 8.87 | 5.98 |
| 10.02.2020 | 4.69 | 6.15 | 3.14 |
© Bayerisches Landesamt für Umwelt 2024