
- Start >
- Rivers >
- Discharge >
- Naab - Regen >
- Johannisthal >
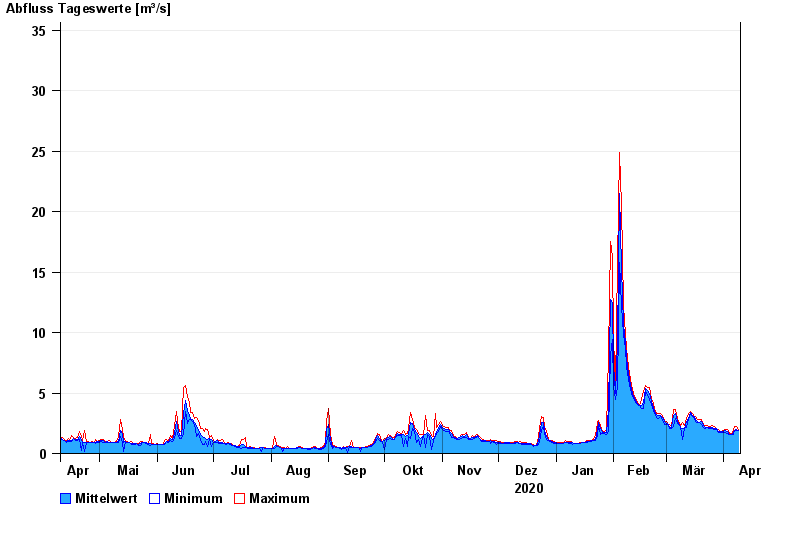
- Chart of year

Chart of year Johannisthal / Tirschenreuther Waldnaab
Discharge from 10.04.2020 to 09.04.2021
- 06.01.1982 Abfluss: 64,1 m³/s
- 06.02.1980 Abfluss: 50,2 m³/s
- 03.01.2003 Abfluss: 49,6 m³/s
- 26.01.1995 Abfluss: 47,6 m³/s
- 02.11.1998 Abfluss: 47,1 m³/s
| Date | Mean value [m³/s] | Maximum [m³/s] | Minimum [m³/s] |
|---|---|---|---|
| 09.04.2021 | 1.91 | 2 | 1.88 |
| 08.04.2021 | 1.99 | 2.23 | 1.88 |
| 07.04.2021 | 1.9 | 2.23 | 1.88 |
| 06.04.2021 | 1.71 | 1.88 | 1.55 |
| 05.04.2021 | 1.57 | 1.66 | 1.55 |
| 04.04.2021 | 1.57 | 1.65 | 1.55 |
| 03.04.2021 | 1.78 | 1.98 | 1.65 |
© Bayerisches Landesamt für Umwelt 2024