
- Start >
- Rivers >
- Discharge >
- Naab - Regen >
- Iglersreuth Speicherzufluss >
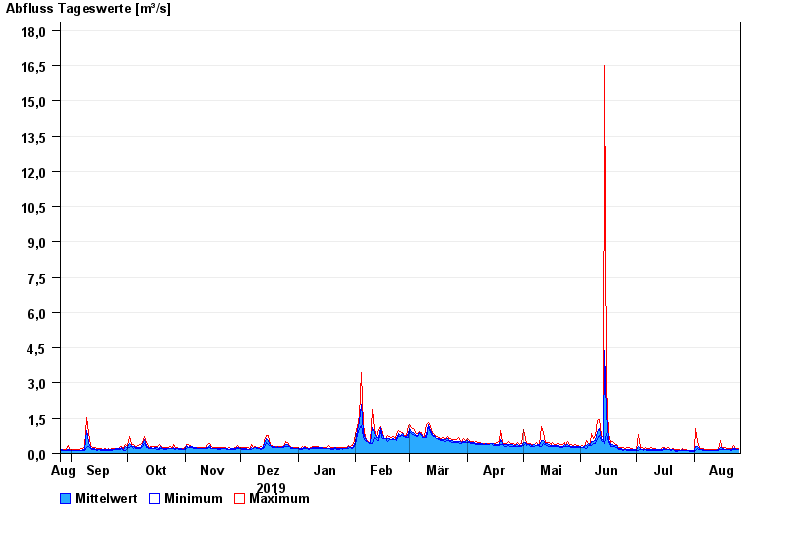
- Chart of year

Chart of year Iglersreuth Speicherzufluss / Tirschenreuther Waldnaab
Discharge from 26.08.2019 to 25.08.2020
| Date | Mean value [m³/s] | Maximum [m³/s] | Minimum [m³/s] |
|---|---|---|---|
| 25.08.2020 | 0.177 | 0.199 | 0.158 |
| 24.08.2020 | 0.176 | 0.198 | 0.157 |
| 23.08.2020 | 0.194 | 0.219 | 0.175 |
| 22.08.2020 | 0.21 | 0.36 | 0.154 |
| 21.08.2020 | 0.161 | 0.193 | 0.135 |
| 20.08.2020 | 0.175 | 0.214 | 0.152 |
| 19.08.2020 | 0.183 | 0.213 | 0.151 |
© Bayerisches Landesamt für Umwelt 2024