
- Start >
- Rivers >
- Discharge >
- Naab - Regen >
- Iglersreuth Speicherzufluss >
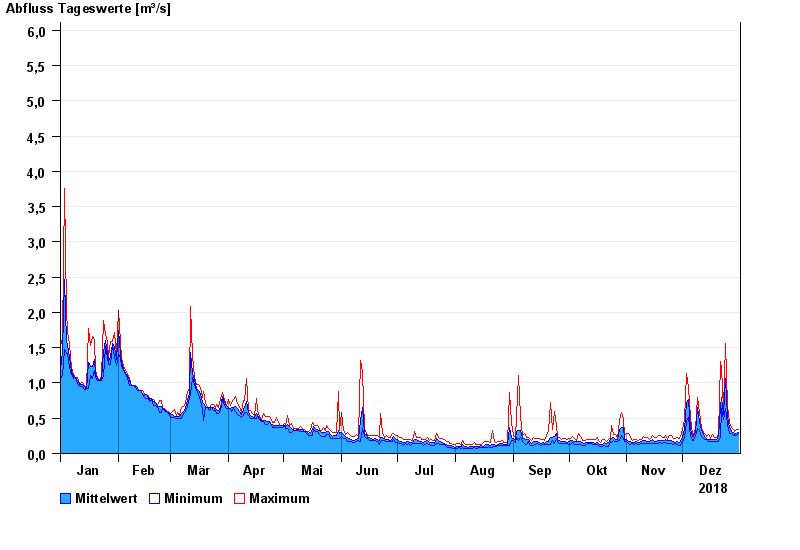
- Chart of year

Chart of year Iglersreuth Speicherzufluss / Tirschenreuther Waldnaab
Discharge from 01.01.2018 to 31.12.2018
- 10.08.1984 Abfluss: 80 m³/s
- 05.05.1984 Abfluss: 31 m³/s
- 06.06.1984 Abfluss: 19 m³/s
- 12.02.2005 Abfluss: 15,4 m³/s
- 26.01.1995 Abfluss: 13 m³/s
| Date | Mean value [m³/s] | Maximum [m³/s] | Minimum [m³/s] |
|---|---|---|---|
| 31.12.2018 | 0.297 | 0.343 | 0.282 |
| 30.12.2018 | 0.29 | 0.343 | 0.254 |
| 29.12.2018 | 0.271 | 0.31 | 0.253 |
| 28.12.2018 | 0.292 | 0.341 | 0.253 |
| 27.12.2018 | 0.311 | 0.374 | 0.279 |
| 26.12.2018 | 0.362 | 0.443 | 0.279 |
| 25.12.2018 | 0.52 | 0.681 | 0.407 |
© Bayerisches Landesamt für Umwelt 2024