
- Start >
- Rivers >
- Discharge >
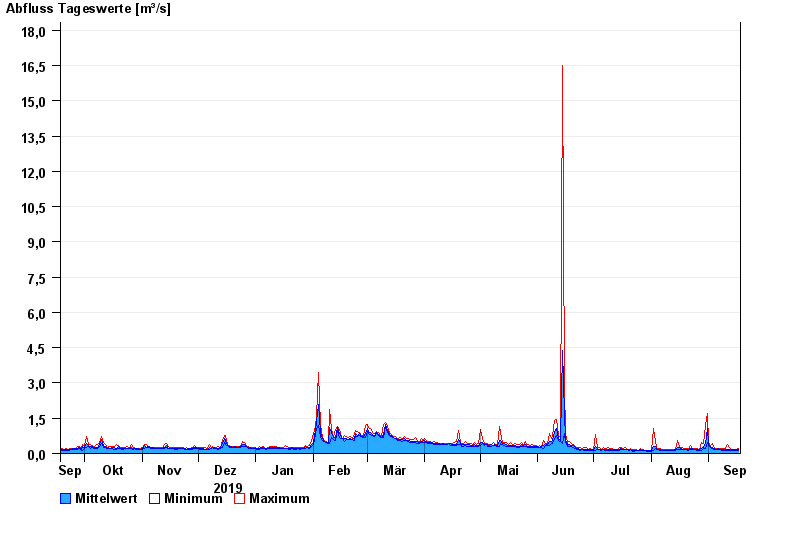
- Naab - Regen >
- Iglersreuth Speicherzufluss >
- Chart of year

Chart of year Iglersreuth Speicherzufluss / Tirschenreuther Waldnaab
Discharge from 18.09.2019 to 17.09.2020
| Date | Mean value [m³/s] | Maximum [m³/s] | Minimum [m³/s] |
|---|---|---|---|
| 17.09.2020 | 0.162 | 0.21 | 0.131 |
| 16.09.2020 | 0.159 | 0.187 | 0.131 |
| 15.09.2020 | 0.158 | 0.187 | 0.131 |
| 14.09.2020 | 0.155 | 0.187 | 0.131 |
| 13.09.2020 | 0.163 | 0.187 | 0.148 |
| 12.09.2020 | 0.178 | 0.259 | 0.148 |
| 11.09.2020 | 0.185 | 0.382 | 0.148 |
© Bayerisches Landesamt für Umwelt 2024