
- Start >
- Rivers >
- Discharge >
- Naab - Regen >
- Iglersreuth Speicherzufluss >
- Chart of year

Chart of year Iglersreuth Speicherzufluss / Tirschenreuther Waldnaab
Discharge from 22.09.2019 to 21.09.2020
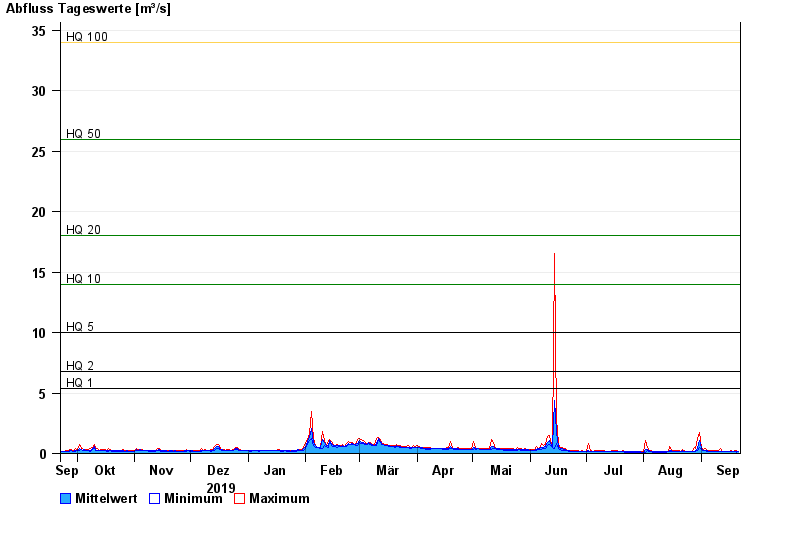
- HQ1 5,4 m³/s
- HQ2 6,8 m³/s
- HQ5 10 m³/s
- HQ10 14 m³/s
- HQ20 18 m³/s
- HQ50 26 m³/s
- HQ100 34 m³/s
| Date | Mean value [m³/s] | Maximum [m³/s] | Minimum [m³/s] |
|---|---|---|---|
| 21.09.2020 | 0.147 | 0.188 | 0.131 |
| 20.09.2020 | 0.167 | 0.21 | 0.115 |
| 19.09.2020 | 0.158 | 0.21 | 0.131 |
| 18.09.2020 | 0.158 | 0.187 | 0.148 |
| 17.09.2020 | 0.162 | 0.21 | 0.131 |
| 16.09.2020 | 0.159 | 0.187 | 0.131 |
| 15.09.2020 | 0.158 | 0.187 | 0.131 |
© Bayerisches Landesamt für Umwelt 2024