
- Start >
- Rivers >
- Discharge >
- Naab - Regen >
- Iglersreuth Speicherzufluss >
- Chart of year

Chart of year Iglersreuth Speicherzufluss / Tirschenreuther Waldnaab
Discharge from 01.01.2018 to 31.12.2018
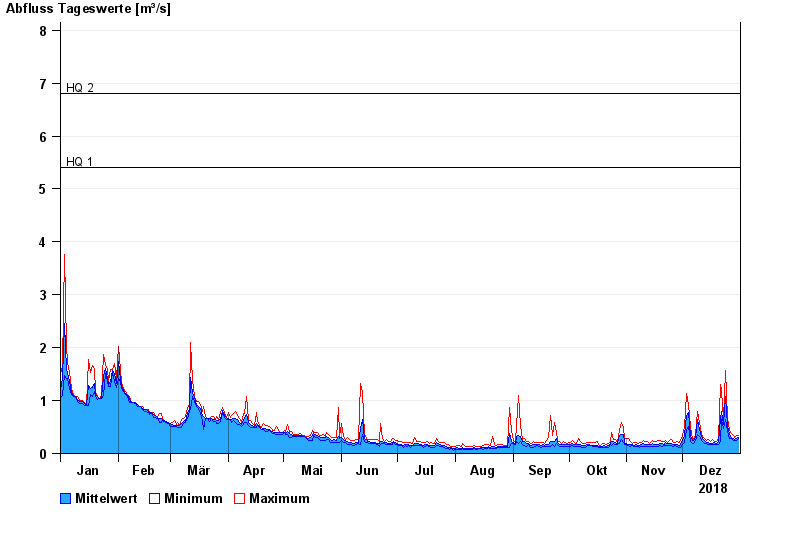
- HQ1 5,4 m³/s
- HQ2 6,8 m³/s
- HQ5 10 m³/s
- HQ10 14 m³/s
- HQ20 18 m³/s
- HQ50 26 m³/s
- HQ100 34 m³/s
| Date | Mean value [m³/s] | Maximum [m³/s] | Minimum [m³/s] |
|---|---|---|---|
| 31.12.2018 | 0.297 | 0.343 | 0.282 |
| 30.12.2018 | 0.29 | 0.343 | 0.254 |
| 29.12.2018 | 0.271 | 0.31 | 0.253 |
| 28.12.2018 | 0.292 | 0.341 | 0.253 |
| 27.12.2018 | 0.311 | 0.374 | 0.279 |
| 26.12.2018 | 0.362 | 0.443 | 0.279 |
| 25.12.2018 | 0.52 | 0.681 | 0.407 |
© Bayerisches Landesamt für Umwelt 2024