
- Start >
- Rivers >
- Discharge >
- Naab - Regen >
- Hof >
- Chart of total period

Chart of total period Hof / Sächsische Saale
Discharge from 01.11.1920 to 19.04.2024
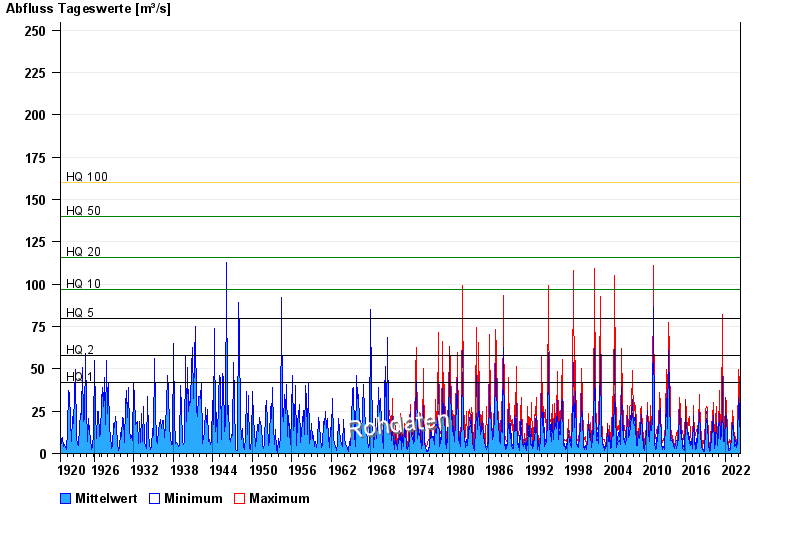
- HQ1 42 m³/s
- HQ2 58 m³/s
- HQ5 80 m³/s
- HQ10 97 m³/s
- HQ20 116 m³/s
- HQ50 140 m³/s
- HQ100 160 m³/s
| Date | Mean value [m³/s] | Maximum [m³/s] | Minimum [m³/s] |
|---|---|---|---|
| 19.04.2024 | 3.11 | 3.36 | 2.96 |
| 18.04.2024 | 3.45 | 3.68 | 3.06 |
| 17.04.2024 | 3.66 | 3.9 | 3.26 |
| 16.04.2024 | 2.91 | 3.36 | 2.59 |
| 15.04.2024 | 3.2 | 3.57 | 2.68 |
| 14.04.2024 | 3.61 | 3.68 | 3.57 |
| 13.04.2024 | 3.71 | 3.78 | 3.57 |
© Bayerisches Landesamt für Umwelt 2024