
- Start >
- Rivers >
- Discharge >
- Naab - Regen >
- Hammermühle >
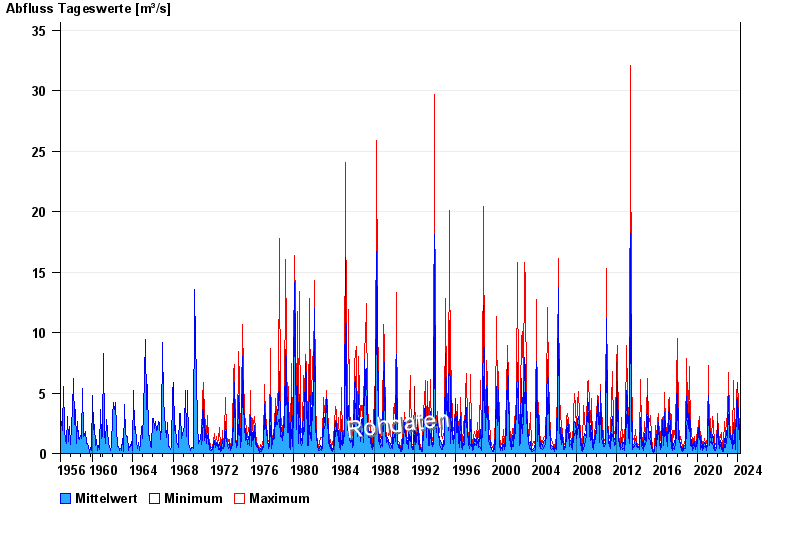
- Chart of total period

Chart of total period Hammermühle / Otterbach
Discharge from 01.11.1956 to 19.04.2024
| Date | Mean value [m³/s] | Maximum [m³/s] | Minimum [m³/s] |
|---|---|---|---|
| 19.04.2024 | 0.648 | 0.72 | 0.609 |
| 18.04.2024 | 0.687 | 0.838 | 0.368 |
| 17.04.2024 | 0.629 | 0.666 | 0.558 |
| 16.04.2024 | 0.49 | 0.609 | 0.411 |
| 15.04.2024 | 0.421 | 0.506 | 0.368 |
| 14.04.2024 | 0.422 | 0.506 | 0.326 |
| 13.04.2024 | 0.409 | 0.458 | 0.326 |
© Bayerisches Landesamt für Umwelt 2024