
- Start >
- Rivers >
- Discharge >
- Naab - Regen >
- Hammerles >
- Chart of year

Chart of year Hammerles / Schweinnaab
Discharge from 09.08.2020 to 08.08.2021
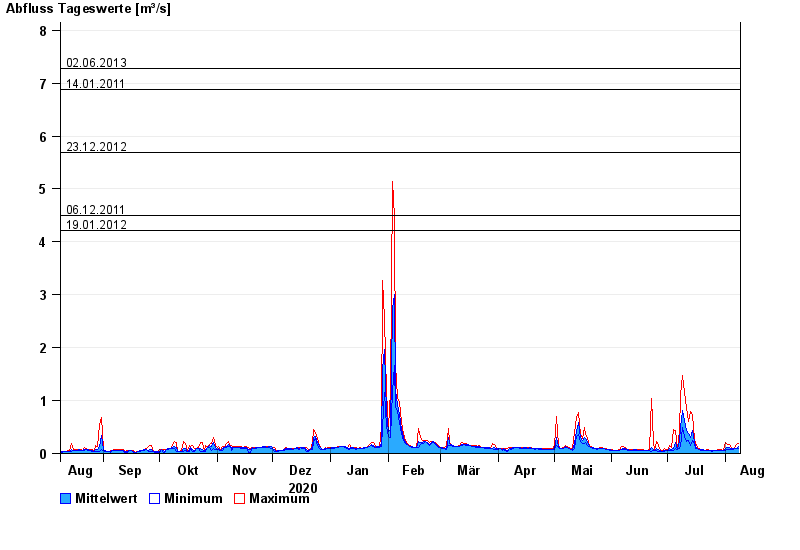
- 02.06.2013 Abfluss: 7,27 m³/s
- 14.01.2011 Abfluss: 6,88 m³/s
- 23.12.2012 Abfluss: 5,69 m³/s
- 06.12.2011 Abfluss: 4,5 m³/s
- 19.01.2012 Abfluss: 4,22 m³/s
| Date | Mean value [m³/s] | Maximum [m³/s] | Minimum [m³/s] |
|---|---|---|---|
| 08.08.2021 | 0.14 | 0.197 | 0.102 |
| 07.08.2021 | 0.103 | 0.164 | 0.086 |
| 06.08.2021 | 0.095 | 0.103 | 0.086 |
| 05.08.2021 | 0.088 | 0.094 | 0.085 |
| 04.08.2021 | 0.095 | 0.112 | 0.085 |
| 03.08.2021 | 0.105 | 0.163 | 0.085 |
| 02.08.2021 | 0.104 | 0.178 | 0.084 |
© Bayerisches Landesamt für Umwelt 2024