
- Start >
- Rivers >
- Discharge >
- Naab - Regen >
- Hammerles >
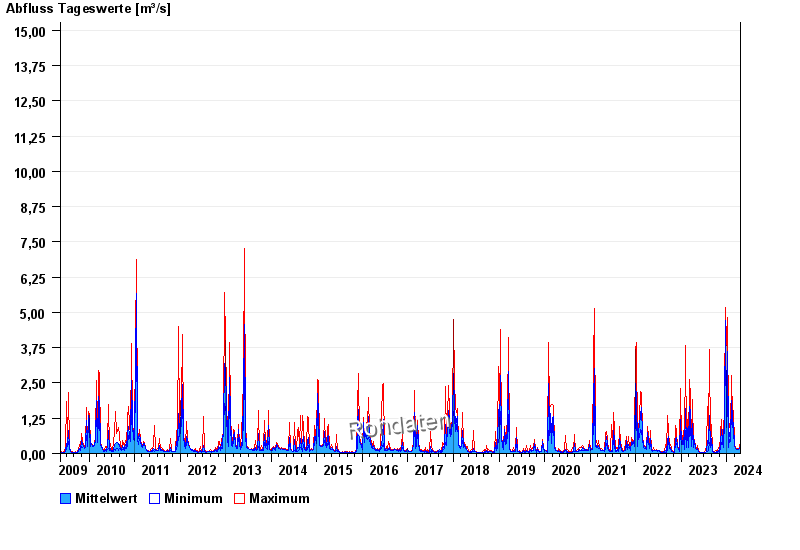
- Chart of total period

Chart of total period Hammerles / Schweinnaab
Discharge from 17.05.2009 to 19.04.2024
 Für diesen Pegel sind keine Jährlichkeiten hinterlegt.
| Date | Mean value [m³/s] | Maximum [m³/s] | Minimum [m³/s] |
|---|---|---|---|
| 19.04.2024 | 0.208 | 0.208 | 0.208 |
| 18.04.2024 | 0.22 | 0.225 | 0.208 |
| 17.04.2024 | 0.248 | 0.284 | 0.225 |
| 16.04.2024 | 0.228 | 0.403 | 0.177 |
| 15.04.2024 | 0.173 | 0.191 | 0.163 |
| 14.04.2024 | 0.158 | 0.163 | 0.139 |
| 13.04.2024 | 0.13 | 0.151 | 0.118 |
© Bayerisches Landesamt für Umwelt 2024