
- Start >
- Rivers >
- Discharge >
- Naab - Regen >
- Grafenwöhr >
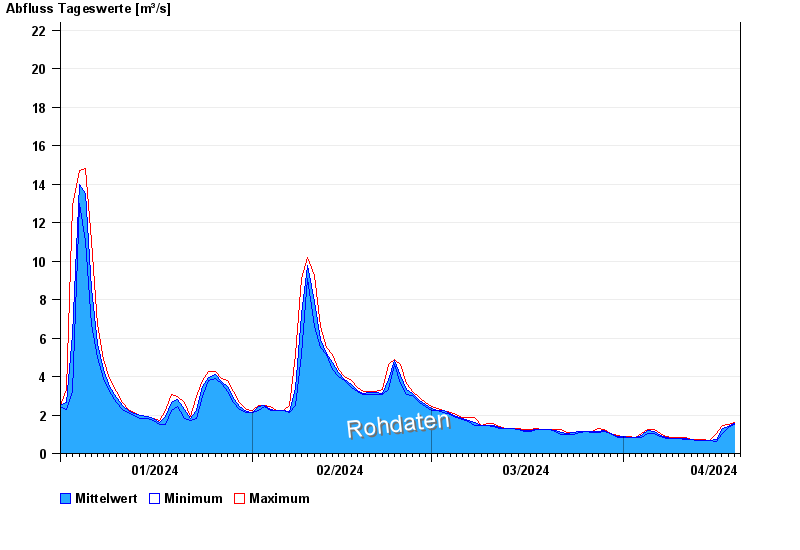
- Chart of year

Chart of year Grafenwöhr / Creußen
Discharge from 01.01.2024 to 19.04.2024
- 26.01.1995 Abfluss: 37,4 m³/s
- 14.01.2011 Abfluss: 36,3 m³/s
- 06.06.1984 Abfluss: 36,2 m³/s
- 03.01.2003 Abfluss: 35,6 m³/s
- 21.12.1993 Abfluss: 34,2 m³/s
| Date | Mean value [m³/s] | Maximum [m³/s] | Minimum [m³/s] |
|---|---|---|---|
| 19.04.2024 | 1.53 | 1.61 | 1.52 |
| 18.04.2024 | 1.38 | 1.52 | 1.34 |
| 17.04.2024 | 1.28 | 1.43 | 1.03 |
| 16.04.2024 | 0.739 | 1.03 | 0.619 |
| 15.04.2024 | 0.67 | 0.67 | 0.67 |
| 14.04.2024 | 0.672 | 0.723 | 0.67 |
| 13.04.2024 | 0.681 | 0.723 | 0.67 |
© Bayerisches Landesamt für Umwelt 2024