
- Start >
- Rivers >
- Discharge >
- Naab - Regen >
- Gogl-Mühle >
- Chart of year

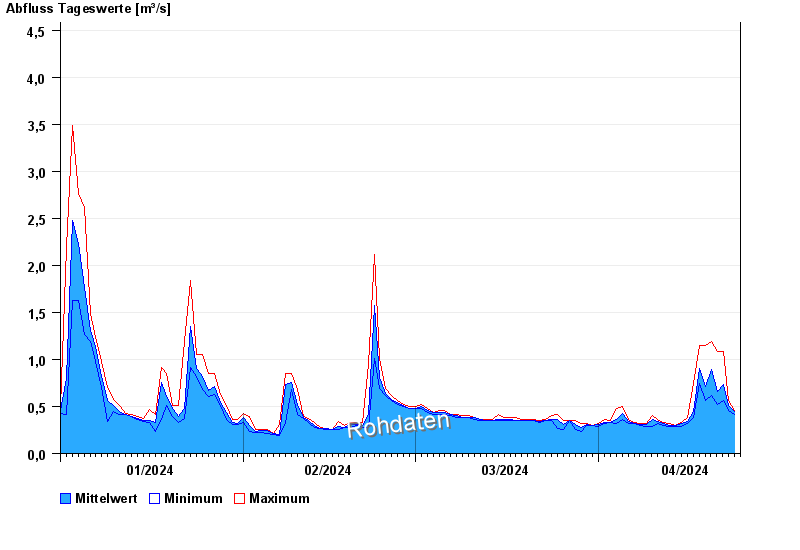
Chart of year Gogl-Mühle / Chamb
Discharge from 01.01.2024 to 24.04.2024
- 01.06.2013 Abfluss: 54,6 m³/s
- 07.08.2010 Abfluss: 24,6 m³/s
- 22.07.1980 Abfluss: 19,2 m³/s
- 11.06.2013 Abfluss: 15,9 m³/s
- 12.08.2002 Abfluss: 12,9 m³/s
| Date | Mean value [m³/s] | Maximum [m³/s] | Minimum [m³/s] |
|---|---|---|---|
| 24.04.2024 | 0.455 | 0.459 | 0.439 |
| 23.04.2024 | 0.505 | 0.567 | 0.459 |
| 22.04.2024 | 0.736 | 1.08 | 0.567 |
| 21.04.2024 | 0.655 | 1.08 | 0.522 |
| 20.04.2024 | 0.888 | 1.19 | 0.613 |
| 19.04.2024 | 0.713 | 1.15 | 0.567 |
| 18.04.2024 | 0.903 | 1.15 | 0.742 |
© Bayerisches Landesamt für Umwelt 2024