
- Start >
- Rivers >
- Discharge >
- Naab - Regen >
- Geisleithen >
- Chart of year

Chart of year Geisleithen / Geisbach
Discharge from 01.01.2024 to 25.04.2024
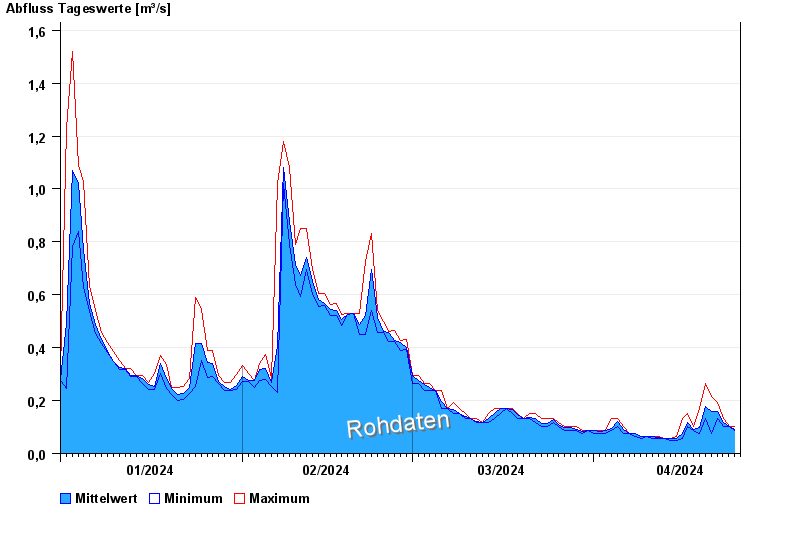
| Date | Mean value [m³/s] | Maximum [m³/s] | Minimum [m³/s] |
|---|---|---|---|
| 25.04.2024 | 0.09 | 0.101 | 0.088 |
| 24.04.2024 | 0.101 | 0.101 | 0.101 |
| 23.04.2024 | 0.117 | 0.133 | 0.101 |
| 22.04.2024 | 0.157 | 0.191 | 0.133 |
| 21.04.2024 | 0.157 | 0.214 | 0.077 |
| 20.04.2024 | 0.176 | 0.266 | 0.133 |
| 19.04.2024 | 0.098 | 0.17 | 0.077 |
© Bayerisches Landesamt für Umwelt 2024