
- Start >
- Rivers >
- Discharge >
- Naab - Regen >
- Fronhof >
- Chart of total period

Chart of total period Fronhof / Murach
Discharge from 01.11.1964 to 25.04.2024
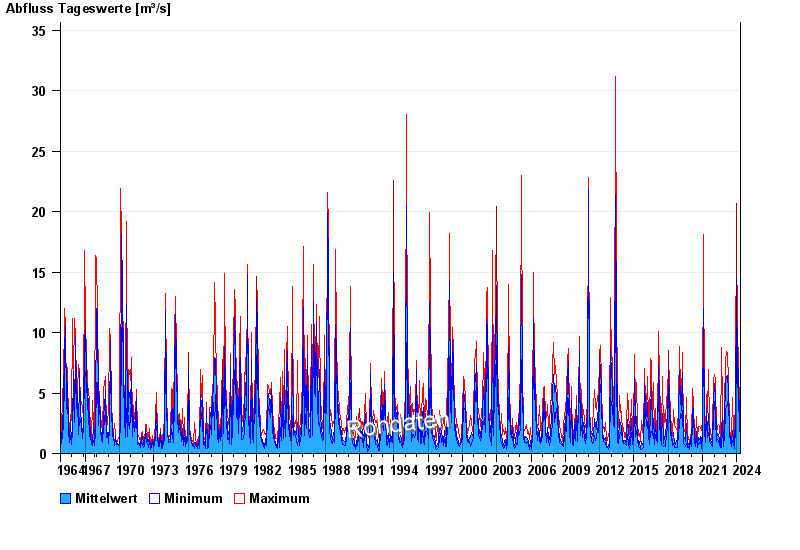
| Date | Mean value [m³/s] | Maximum [m³/s] | Minimum [m³/s] |
|---|---|---|---|
| 25.04.2024 | 1.82 | 2.04 | 1.67 |
| 24.04.2024 | 1.82 | 1.94 | 1.67 |
| 23.04.2024 | 1.91 | 2.13 | 1.76 |
| 22.04.2024 | 2.33 | 2.76 | 2.09 |
| 21.04.2024 | 2.67 | 3.16 | 2.18 |
| 20.04.2024 | 3.51 | 4.43 | 2.66 |
| 19.04.2024 | 2 | 3.32 | 1.59 |
© Bayerisches Landesamt für Umwelt 2024