
- Start >
- Rivers >
- Discharge >
- Naab - Regen >
- Friedersreuth >
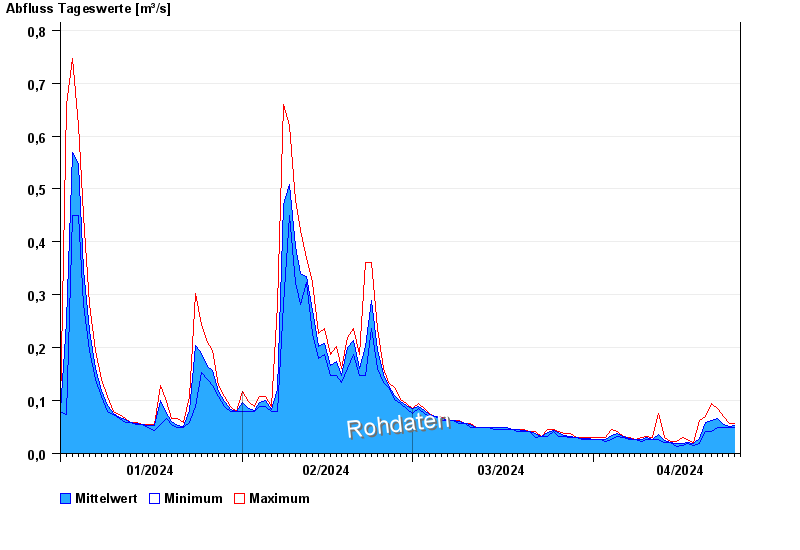
- Chart of year

Chart of year Friedersreuth / Schweinnaab
Discharge from 01.01.2024 to 25.04.2024
- 13.01.2011 Abfluss: 3,29 m³/s
- 23.12.2012 Abfluss: 2,05 m³/s
- 02.06.2013 Abfluss: 2,04 m³/s
- 02.08.2010 Abfluss: 1,64 m³/s
- 30.01.2013 Abfluss: 1,5 m³/s
| Date | Mean value [m³/s] | Maximum [m³/s] | Minimum [m³/s] |
|---|---|---|---|
| 25.04.2024 | 0.053 | 0.056 | 0.05 |
| 24.04.2024 | 0.05 | 0.056 | 0.05 |
| 23.04.2024 | 0.055 | 0.069 | 0.05 |
| 22.04.2024 | 0.066 | 0.085 | 0.05 |
| 21.04.2024 | 0.062 | 0.094 | 0.041 |
| 20.04.2024 | 0.058 | 0.069 | 0.041 |
| 19.04.2024 | 0.029 | 0.062 | 0.018 |
© Bayerisches Landesamt für Umwelt 2024