
- Start >
- Rivers >
- Discharge >
- Naab - Regen >
- Friedersreuth >
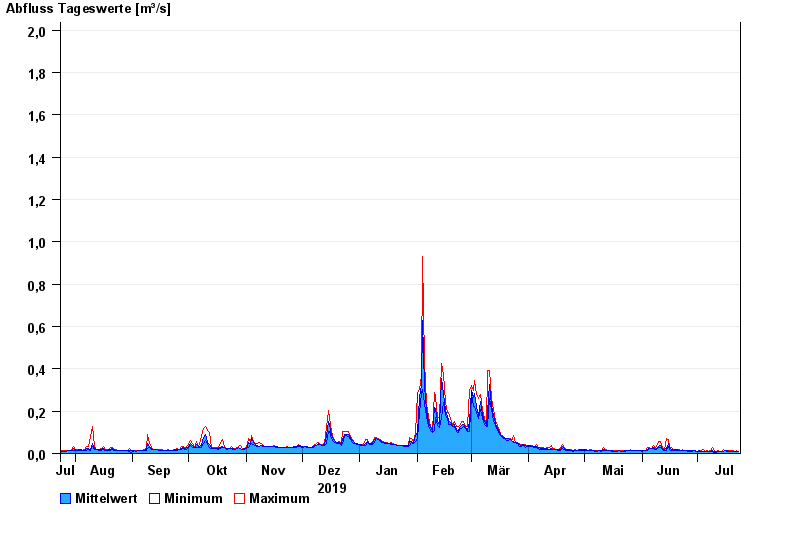
- Chart of year

Chart of year Friedersreuth / Schweinnaab
Discharge from 24.07.2019 to 23.07.2020
 Für diesen Pegel sind keine Jährlichkeiten hinterlegt.
| Date | Mean value [m³/s] | Maximum [m³/s] | Minimum [m³/s] |
|---|---|---|---|
| 23.07.2020 | 0.008 | 0.01 | 0.008 |
| 22.07.2020 | 0.009 | 0.014 | 0.008 |
| 21.07.2020 | 0.01 | 0.01 | 0.008 |
| 20.07.2020 | 0.01 | 0.012 | 0.01 |
| 19.07.2020 | 0.01 | 0.012 | 0.01 |
| 18.07.2020 | 0.011 | 0.014 | 0.01 |
| 17.07.2020 | 0.012 | 0.014 | 0.01 |
© Bayerisches Landesamt für Umwelt 2024