
- Start >
- Rivers >
- Discharge >
- Naab - Regen >
- Eschlkam >
- Chart of total period

Chart of total period Eschlkam / Chamb
Discharge from 01.05.2007 to 19.04.2024
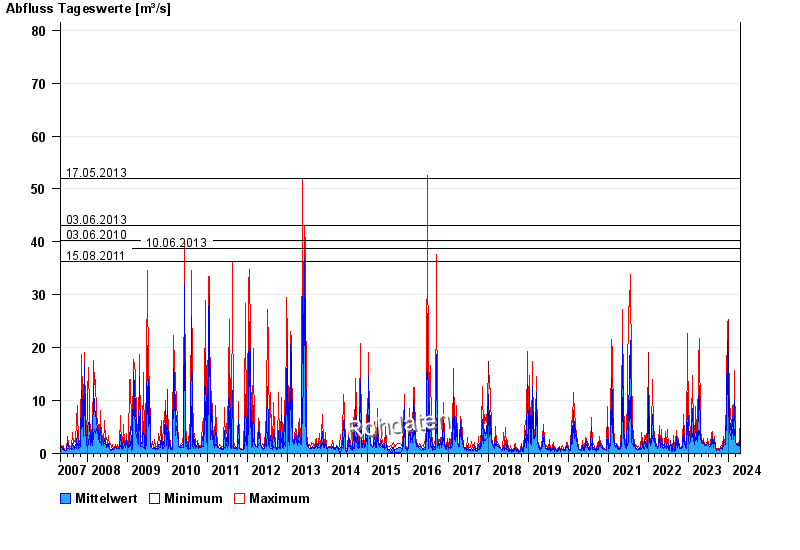
- 17.05.2013 Abfluss: 52 m³/s
- 03.06.2013 Abfluss: 43,1 m³/s
- 03.06.2010 Abfluss: 40,3 m³/s
- 10.06.2013 Abfluss: 38,8 m³/s
- 15.08.2011 Abfluss: 36,2 m³/s
| Date | Mean value [m³/s] | Maximum [m³/s] | Minimum [m³/s] |
|---|---|---|---|
| 19.04.2024 | 3.82 | 3.82 | 3.82 |
| 18.04.2024 | 3.64 | 4.62 | 2.36 |
| 17.04.2024 | 1.88 | 2.31 | 1.6 |
| 16.04.2024 | 1.44 | 1.66 | 1.22 |
| 15.04.2024 | 1.32 | 1.6 | 1.16 |
| 14.04.2024 | 1.16 | 1.22 | 1.16 |
| 13.04.2024 | 1.2 | 1.22 | 1.06 |
© Bayerisches Landesamt für Umwelt 2024