
- Start >
- Rivers >
- Discharge >
- Naab - Regen >
- Donauwörth >
- Chart of year

Chart of year Donauwörth / Donau
Discharge from 20.07.2019 to 19.07.2020
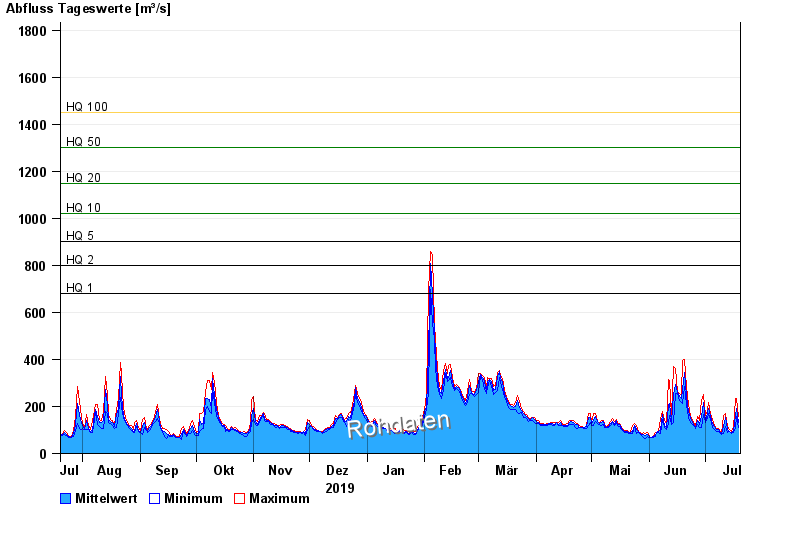
- HQ1 680 m³/s
- HQ2 800 m³/s
- HQ5 900 m³/s
- HQ10 1020 m³/s
- HQ20 1150 m³/s
- HQ50 1300 m³/s
- HQ100 1450 m³/s
| Date | Mean value [m³/s] | Maximum [m³/s] | Minimum [m³/s] |
|---|---|---|---|
| 19.07.2020 | 131 | 156 | 112 |
| 18.07.2020 | 193 | 234 | 158 |
| 17.07.2020 | 162 | 233 | 109 |
| 16.07.2020 | 96.8 | 109 | 89.1 |
| 15.07.2020 | 88 | 91.5 | 86 |
| 14.07.2020 | 95 | 104 | 91.5 |
| 13.07.2020 | 103 | 115 | 89.1 |
© Bayerisches Landesamt für Umwelt 2024