
- Start >
- Rivers >
- Discharge >
- Naab - Regen >
- Donauwörth >
- Chart of year

Chart of year Donauwörth / Donau
Discharge from 23.01.2020 to 22.01.2021
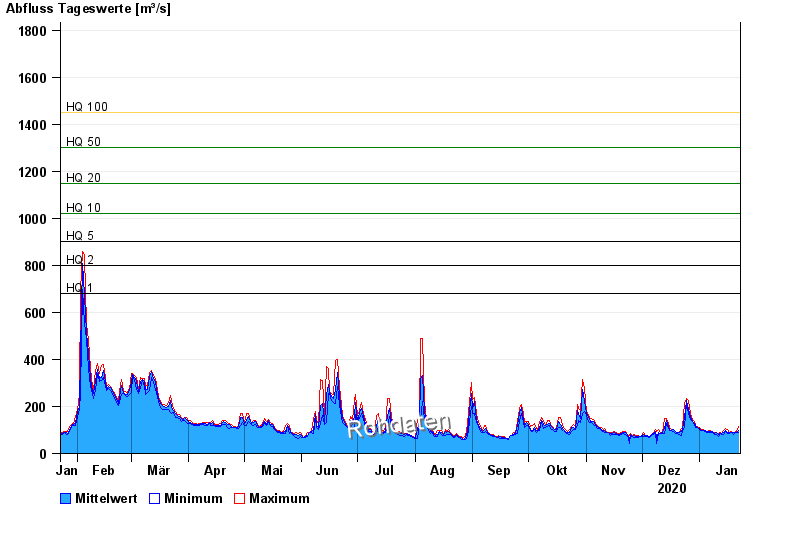
- HQ1 680 m³/s
- HQ2 800 m³/s
- HQ5 900 m³/s
- HQ10 1020 m³/s
- HQ20 1150 m³/s
- HQ50 1300 m³/s
- HQ100 1450 m³/s
| Date | Mean value [m³/s] | Maximum [m³/s] | Minimum [m³/s] |
|---|---|---|---|
| 22.01.2021 | 98.4 | 114 | 89.8 |
| 21.01.2021 | 90.4 | 91.9 | 88.3 |
| 20.01.2021 | 87.2 | 88.3 | 86.3 |
| 19.01.2021 | 87.6 | 90.9 | 82.9 |
| 18.01.2021 | 91.3 | 91.9 | 89.8 |
| 17.01.2021 | 89.5 | 90.9 | 86.3 |
| 16.01.2021 | 88.5 | 100 | 83.8 |
© Bayerisches Landesamt für Umwelt 2024