
- Start >
- Rivers >
- Discharge >
- Naab - Regen >
- Böhmischbruck >
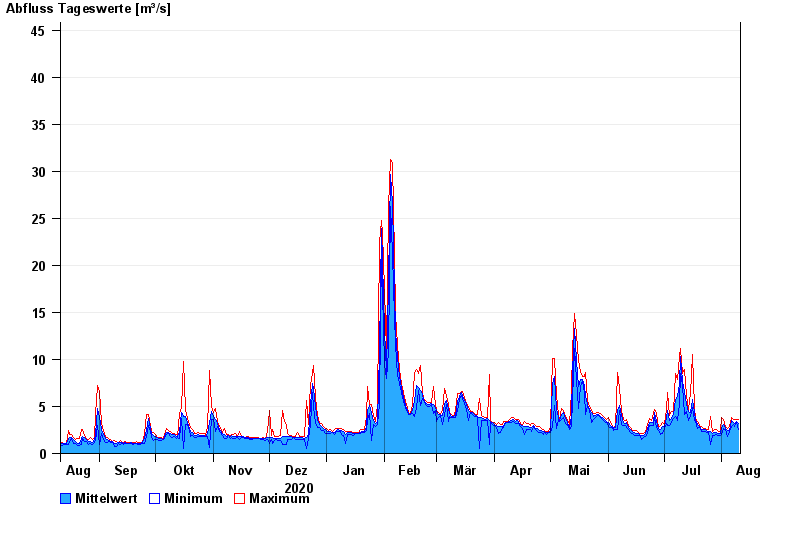
- Chart of year

Chart of year Böhmischbruck / Pfreimd
Discharge from 11.08.2020 to 10.08.2021
- 10.07.1954 Abfluss: 92,3 m³/s
- 01.12.1947 Abfluss: 90 m³/s
- 03.03.1956 Abfluss: 89,4 m³/s
- 03.01.2003 Abfluss: 74,6 m³/s
- 12.01.1936 Abfluss: 73,6 m³/s
| Date | Mean value [m³/s] | Maximum [m³/s] | Minimum [m³/s] |
|---|---|---|---|
| 10.08.2021 | 3.2 | 3.63 | 2.56 |
| 09.08.2021 | 3.42 | 3.63 | 3.26 |
| 08.08.2021 | 3.15 | 3.62 | 2.9 |
| 07.08.2021 | 3.27 | 3.62 | 3.07 |
| 06.08.2021 | 3.48 | 3.8 | 2.89 |
| 05.08.2021 | 2.49 | 2.89 | 2.38 |
| 04.08.2021 | 2.47 | 2.71 | 1.77 |
© Bayerisches Landesamt für Umwelt 2024