
- Start >
- Rivers >
- Discharge >
- Naab - Regen >
- Böhmischbruck >
- Chart of year

Chart of year Böhmischbruck / Pfreimd
Discharge from 11.08.2019 to 10.08.2020
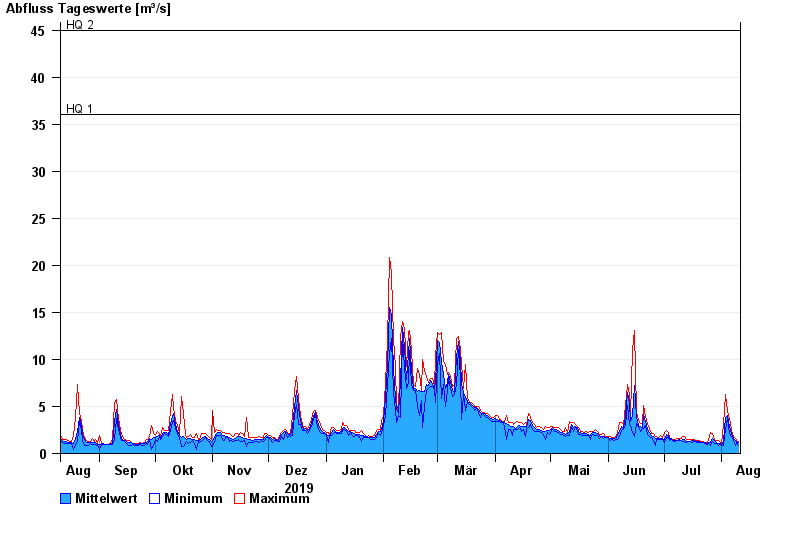
- HQ1 36 m³/s
- HQ2 45 m³/s
- HQ5 55 m³/s
- HQ10 65 m³/s
- HQ20 75 m³/s
- HQ50 90 m³/s
- HQ100 100 m³/s
| Date | Mean value [m³/s] | Maximum [m³/s] | Minimum [m³/s] |
|---|---|---|---|
| 10.08.2020 | 1.12 | 1.31 | 0.884 |
| 09.08.2020 | 1.31 | 1.43 | 1.19 |
| 08.08.2020 | 1.39 | 1.56 | 0.881 |
| 07.08.2020 | 1.64 | 1.83 | 1.43 |
| 06.08.2020 | 2.08 | 2.45 | 1.83 |
| 05.08.2020 | 2.91 | 3.69 | 2.13 |
| 04.08.2020 | 4.07 | 4.46 | 3.69 |
© Bayerisches Landesamt für Umwelt 2024