
- Start >
- Rivers >
- Discharge >
- Naab - Regen >
- Böhmischbruck >
- Chart of year

Chart of year Böhmischbruck / Pfreimd
Discharge from 01.01.2021 to 31.12.2021
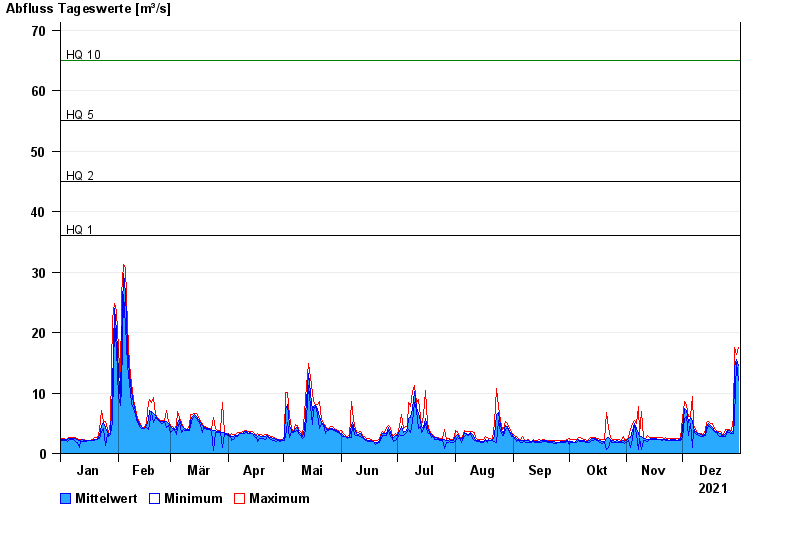
- HQ1 36 m³/s
- HQ2 45 m³/s
- HQ5 55 m³/s
- HQ10 65 m³/s
- HQ20 75 m³/s
- HQ50 90 m³/s
- HQ100 100 m³/s
| Date | Mean value [m³/s] | Maximum [m³/s] | Minimum [m³/s] |
|---|---|---|---|
| 31.12.2021 | 14.6 | 17.5 | 12 |
| 30.12.2021 | 15.6 | 16.4 | 15 |
| 29.12.2021 | 14.2 | 17.6 | 5.85 |
| 28.12.2021 | 3.82 | 5.85 | 3.25 |
| 27.12.2021 | 3.49 | 3.82 | 3.25 |
| 26.12.2021 | 3.77 | 4 | 3.43 |
| 25.12.2021 | 3.87 | 4 | 3.61 |
© Bayerisches Landesamt für Umwelt 2024