
- Start >
- Rivers >
- Discharge >
- Naab - Regen >
- Böhmischbruck >
- Chart of total period

Chart of total period Böhmischbruck / Pfreimd
Discharge from 01.11.1930 to 19.04.2024
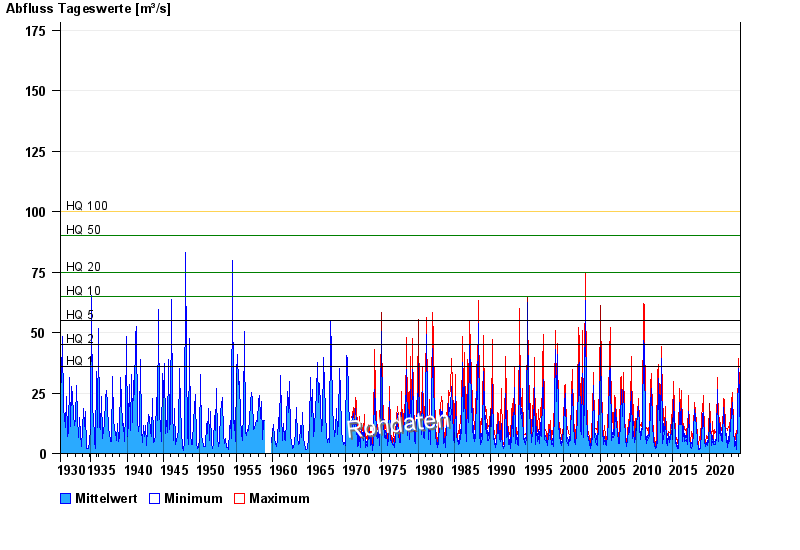
- HQ1 36 m³/s
- HQ2 45 m³/s
- HQ5 55 m³/s
- HQ10 65 m³/s
- HQ20 75 m³/s
- HQ50 90 m³/s
- HQ100 100 m³/s
| Date | Mean value [m³/s] | Maximum [m³/s] | Minimum [m³/s] |
|---|---|---|---|
| 19.04.2024 | 7.65 | 9.49 | 7.31 |
| 18.04.2024 | 7.05 | 7.31 | 6.66 |
| 17.04.2024 | 6.55 | 7.53 | 5.6 |
| 16.04.2024 | 5.17 | 5.82 | 4.99 |
| 15.04.2024 | 4.71 | 4.99 | 3.99 |
| 14.04.2024 | 4.39 | 4.58 | 4.18 |
| 13.04.2024 | 4.37 | 4.58 | 4.18 |
© Bayerisches Landesamt für Umwelt 2024