
- Start >
- Rivers >
- Discharge >
- Naab - Regen >
- Amberg >
- Chart of total period

Chart of total period Amberg / Vils
Discharge from 01.11.1948 to 24.04.2024
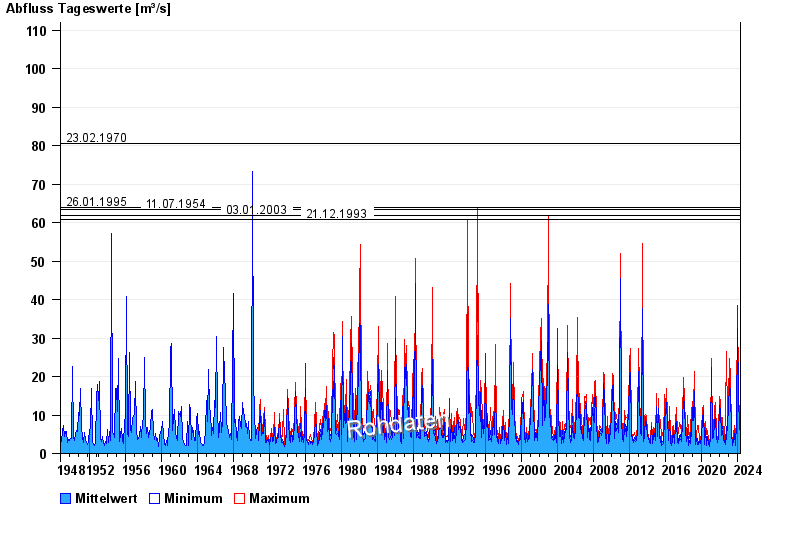
- 23.02.1970 Abfluss: 80,5 m³/s
- 26.01.1995 Abfluss: 63,9 m³/s
- 11.07.1954 Abfluss: 63,3 m³/s
- 03.01.2003 Abfluss: 61,9 m³/s
- 21.12.1993 Abfluss: 60,9 m³/s
| Date | Mean value [m³/s] | Maximum [m³/s] | Minimum [m³/s] |
|---|---|---|---|
| 24.04.2024 | 4.94 | 5.06 | 4.72 |
| 23.04.2024 | 5.52 | 5.77 | 5.06 |
| 22.04.2024 | 6.42 | 7.09 | 5.4 |
| 21.04.2024 | 6.25 | 7.09 | 5.58 |
| 20.04.2024 | 5.82 | 6.32 | 4.88 |
| 19.04.2024 | 4.13 | 5.4 | 3.46 |
| 18.04.2024 | 3.9 | 4.22 | 3.61 |
© Bayerisches Landesamt für Umwelt 2024