
- Start >
- Rivers >
- Discharge >
- Naab - Regen >
- Amberg >
- Chart of total period

Chart of total period Amberg / Vils
Discharge from 01.11.1948 to 20.04.2024
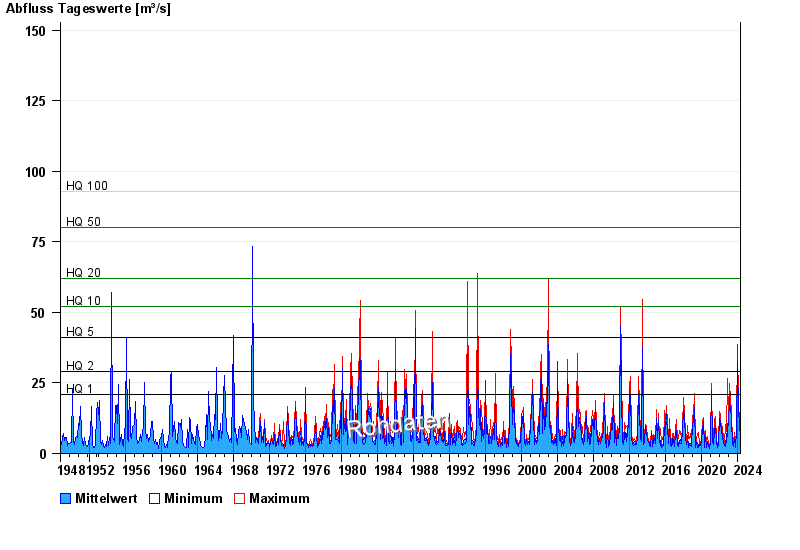
- HQ1 21 m³/s
- HQ2 29 m³/s
- HQ5 41 m³/s
- HQ10 52 m³/s
- HQ20 62 m³/s
- HQ50 80 m³/s
- HQ100 93 m³/s
| Date | Mean value [m³/s] | Maximum [m³/s] | Minimum [m³/s] |
|---|---|---|---|
| 20.04.2024 | 5.75 | 6.32 | 4.88 |
| 19.04.2024 | 4.13 | 5.4 | 3.46 |
| 18.04.2024 | 3.9 | 4.22 | 3.61 |
| 17.04.2024 | 3.81 | 4.07 | 3.46 |
| 16.04.2024 | 3.43 | 3.91 | 3.05 |
| 15.04.2024 | 3.22 | 3.46 | 2.79 |
| 14.04.2024 | 3.02 | 3.18 | 2.79 |
© Bayerisches Landesamt für Umwelt 2024