
- Start >
- Rivers >
- Discharge >
- Unterer Main >
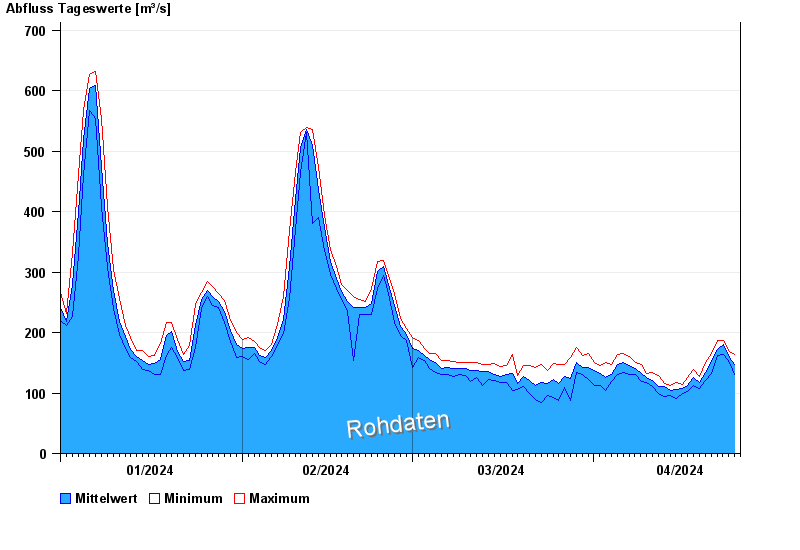
- Würzburg Q >
- Chart of year

Chart of year Würzburg Q / Main
Discharge from 01.01.2024 to 25.04.2024
note
Ultraschallanlage; kein Hochwasserpegel;
| Date | Mean value [m³/s] | Maximum [m³/s] | Minimum [m³/s] |
|---|---|---|---|
| 25.04.2024 | 149 | 164 | 132 |
| 24.04.2024 | 158 | 168 | 150 |
| 23.04.2024 | 181 | 187 | 164 |
| 22.04.2024 | 172 | 187 | 162 |
| 21.04.2024 | 152 | 166 | 132 |
| 20.04.2024 | 134 | 150 | 120 |
| 19.04.2024 | 117 | 128 | 108 |
© Bayerisches Landesamt für Umwelt 2024