
- Start >
- Rivers >
- Discharge >
- Unterer Main >
- Würzburg >
- Chart of total period

Chart of total period Würzburg / Main
Discharge from 01.01.2000 to 25.04.2024
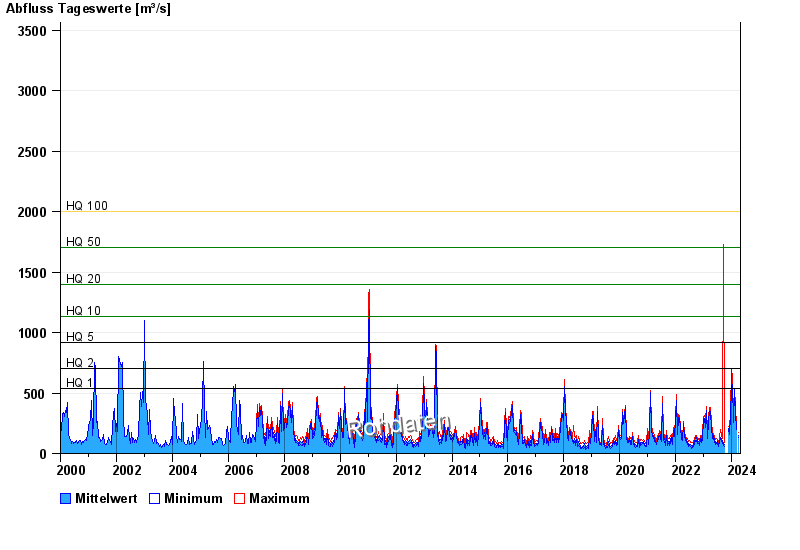
- HQ1 540 m³/s
- HQ2 700 m³/s
- HQ5 920 m³/s
- HQ10 1130 m³/s
- HQ20 1400 m³/s
- HQ50 1700 m³/s
- HQ100 2000 m³/s
| Date | Mean value [m³/s] | Maximum [m³/s] | Minimum [m³/s] |
|---|---|---|---|
| 25.04.2024 | 162 | 164 | 160 |
| 24.04.2024 | 158 | 168 | 150 |
| 23.04.2024 | 181 | 187 | 164 |
| 22.04.2024 | 172 | 187 | 162 |
| 21.04.2024 | -- | -- | -- |
| 20.04.2024 | -- | -- | -- |
| 19.04.2024 | -- | -- | -- |
© Bayerisches Landesamt für Umwelt 2024