
- Start >
- Rivers >
- Discharge >
- Unterer Main >
- Weilbach >
- Chart of year

Chart of year Weilbach / Mud
Discharge from 06.10.2020 to 05.10.2021
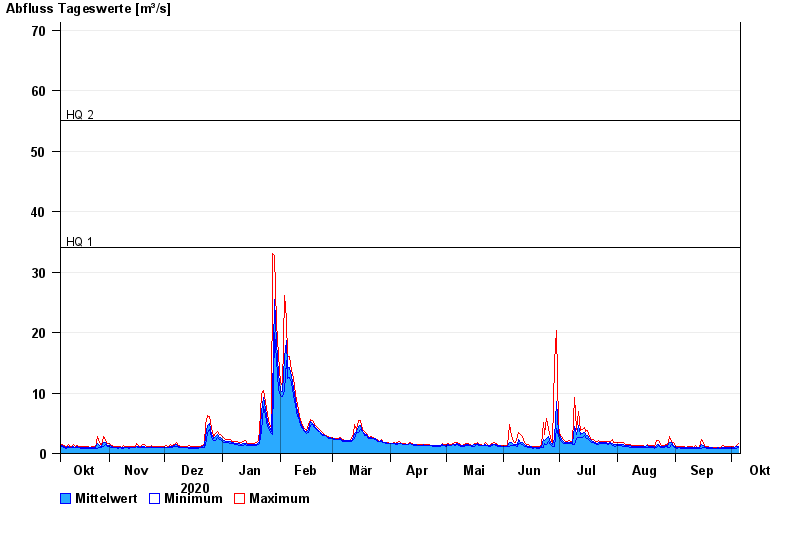
- HQ1 34 m³/s
- HQ2 55 m³/s
- HQ5 85 m³/s
- HQ10 105 m³/s
- HQ20 130 m³/s
- HQ50 155 m³/s
- HQ100 180 m³/s
| Date | Mean value [m³/s] | Maximum [m³/s] | Minimum [m³/s] |
|---|---|---|---|
| 05.10.2021 | 1.22 | 1.58 | 0.956 |
| 04.10.2021 | 1.12 | 1.34 | 0.903 |
| 03.10.2021 | 0.97 | 1.07 | 0.903 |
| 02.10.2021 | 0.947 | 1.08 | 0.805 |
| 01.10.2021 | 0.954 | 1.08 | 0.854 |
| 30.09.2021 | 0.987 | 1.21 | 0.855 |
| 29.09.2021 | 0.963 | 1.08 | 0.856 |
© Bayerisches Landesamt für Umwelt 2024