
- Start >
- Rivers >
- Discharge >
- Unterer Main >
- Weilbach >
- Chart of year

Chart of year Weilbach / Mud
Discharge from 01.01.2024 to 25.04.2024
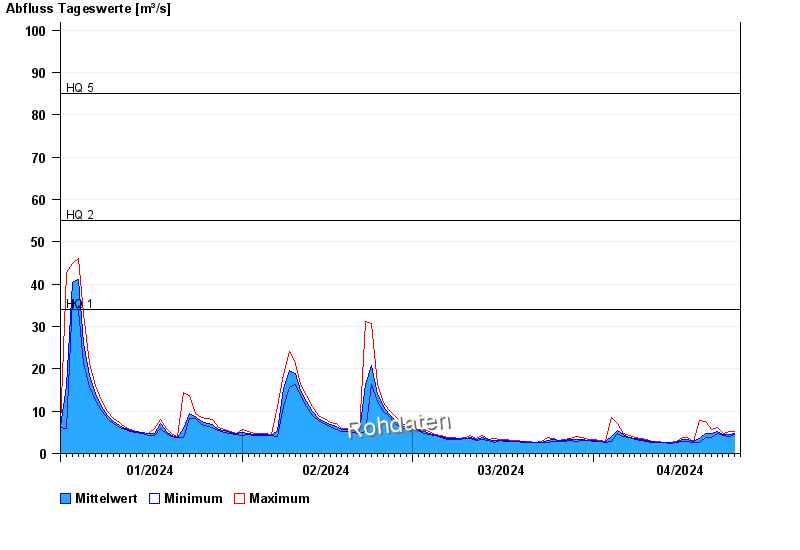
- HQ1 34 m³/s
- HQ2 55 m³/s
- HQ5 85 m³/s
- HQ10 105 m³/s
- HQ20 130 m³/s
- HQ50 155 m³/s
- HQ100 180 m³/s
| Date | Mean value [m³/s] | Maximum [m³/s] | Minimum [m³/s] |
|---|---|---|---|
| 25.04.2024 | 4.61 | 5.02 | 4.33 |
| 24.04.2024 | 4.35 | 5.02 | 4.01 |
| 23.04.2024 | 4.43 | 4.67 | 4.17 |
| 22.04.2024 | 5.23 | 6.19 | 4.67 |
| 21.04.2024 | 4.78 | 5.78 | 3.86 |
| 20.04.2024 | 4.71 | 7.47 | 3.86 |
| 19.04.2024 | 3.66 | 7.7 | 2.65 |
© Bayerisches Landesamt für Umwelt 2024