
- Start >
- Rivers >
- Discharge >
- Unterer Main >
- Untermerzbach >
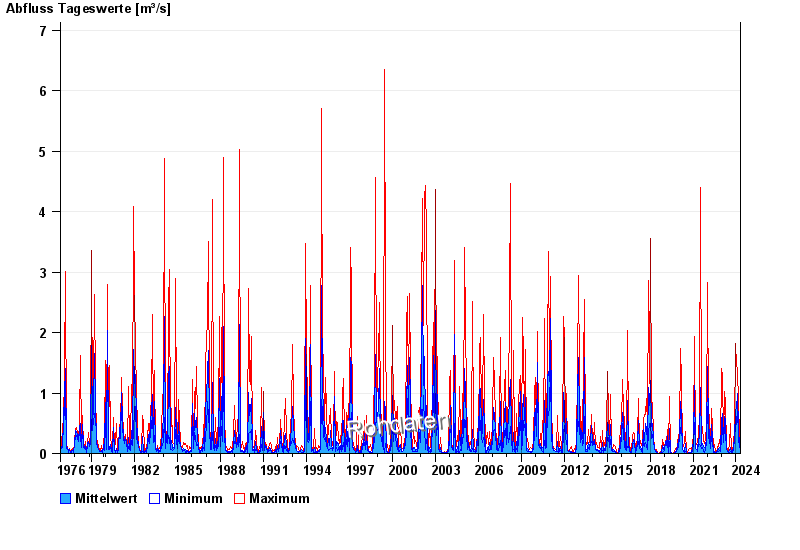
- Chart of total period

Chart of total period Untermerzbach / Merzbach
Discharge from 01.11.1976 to 25.04.2024
| Date | Mean value [m³/s] | Maximum [m³/s] | Minimum [m³/s] |
|---|---|---|---|
| 25.04.2024 | 0.048 | 0.05 | 0.043 |
| 24.04.2024 | 0.06 | 0.067 | 0.05 |
| 23.04.2024 | 0.059 | 0.067 | 0.043 |
| 22.04.2024 | 0.089 | 0.118 | 0.067 |
| 21.04.2024 | 0.14 | 0.185 | 0.058 |
| 20.04.2024 | 0.087 | 0.143 | 0.058 |
| 19.04.2024 | 0.062 | 0.143 | 0.028 |
© Bayerisches Landesamt für Umwelt 2024