
- Start >
- Rivers >
- Discharge >
- Unterer Main >
- Trunstadt >
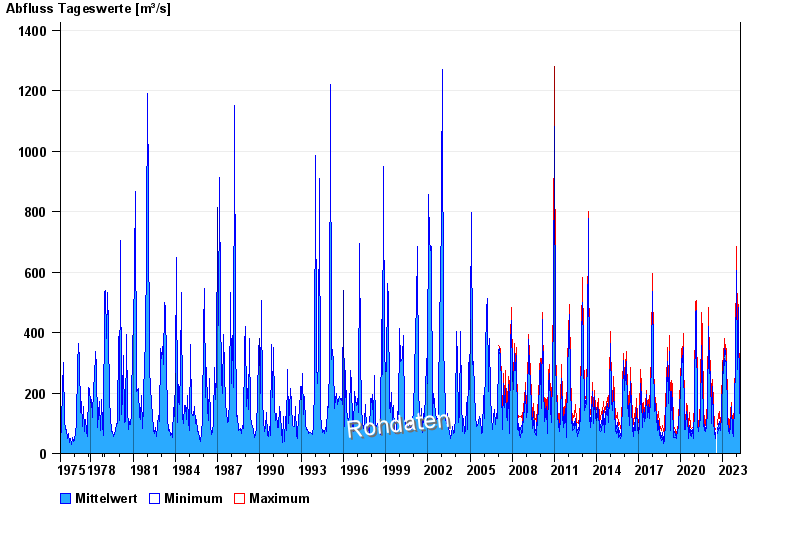
- Chart of total period

Chart of total period Trunstadt / Main
Discharge from 01.11.1975 to 07.04.2024
| Date | Mean value [m³/s] | Maximum [m³/s] | Minimum [m³/s] |
|---|---|---|---|
| 07.04.2024 | 112 | 121 | 105 |
| 06.04.2024 | 128 | 144 | 115 |
| 05.04.2024 | 127 | 138 | 107 |
| 04.04.2024 | -- | -- | -- |
| 03.04.2024 | 103 | 111 | 99 |
| 02.04.2024 | -- | -- | -- |
| 01.04.2024 | 102 | 109 | 99 |
© Bayerisches Landesamt für Umwelt 2024