
- Start >
- Rivers >
- Discharge >
- Unterer Main >
- Steinbach >
- Chart of year

Chart of year Steinbach / Main
Discharge from 01.01.2021 to 31.12.2021
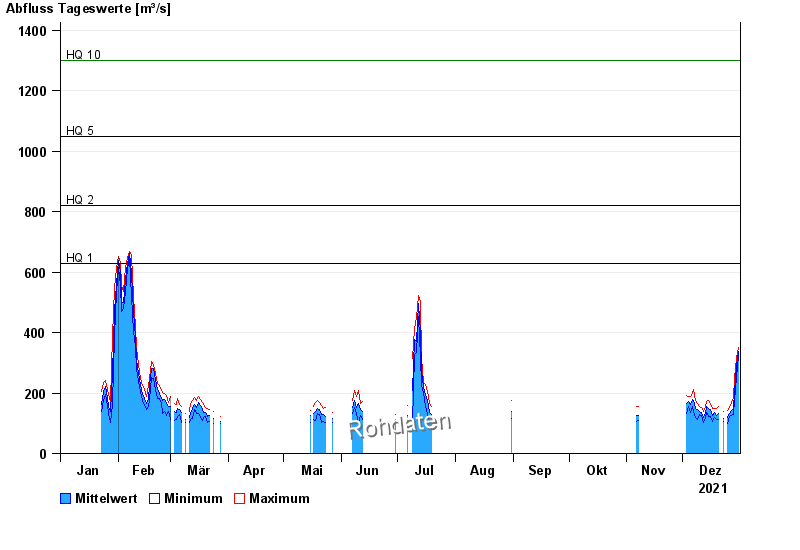
- HQ1 630 m³/s
- HQ2 820 m³/s
- HQ5 1050 m³/s
- HQ10 1300 m³/s
- HQ20 1600 m³/s
- HQ50 1900 m³/s
- HQ100 2200 m³/s
| Date | Mean value [m³/s] | Maximum [m³/s] | Minimum [m³/s] |
|---|---|---|---|
| 31.12.2021 | 339 | 352 | 325 |
| 30.12.2021 | 290 | 318 | 251 |
| 29.12.2021 | 204 | 249 | 176 |
| 28.12.2021 | 150 | 185 | 128 |
| 27.12.2021 | 142 | 169 | 126 |
| 26.12.2021 | 133 | 151 | 124 |
| 25.12.2021 | 118 | 142 | 100 |
© Bayerisches Landesamt für Umwelt 2024